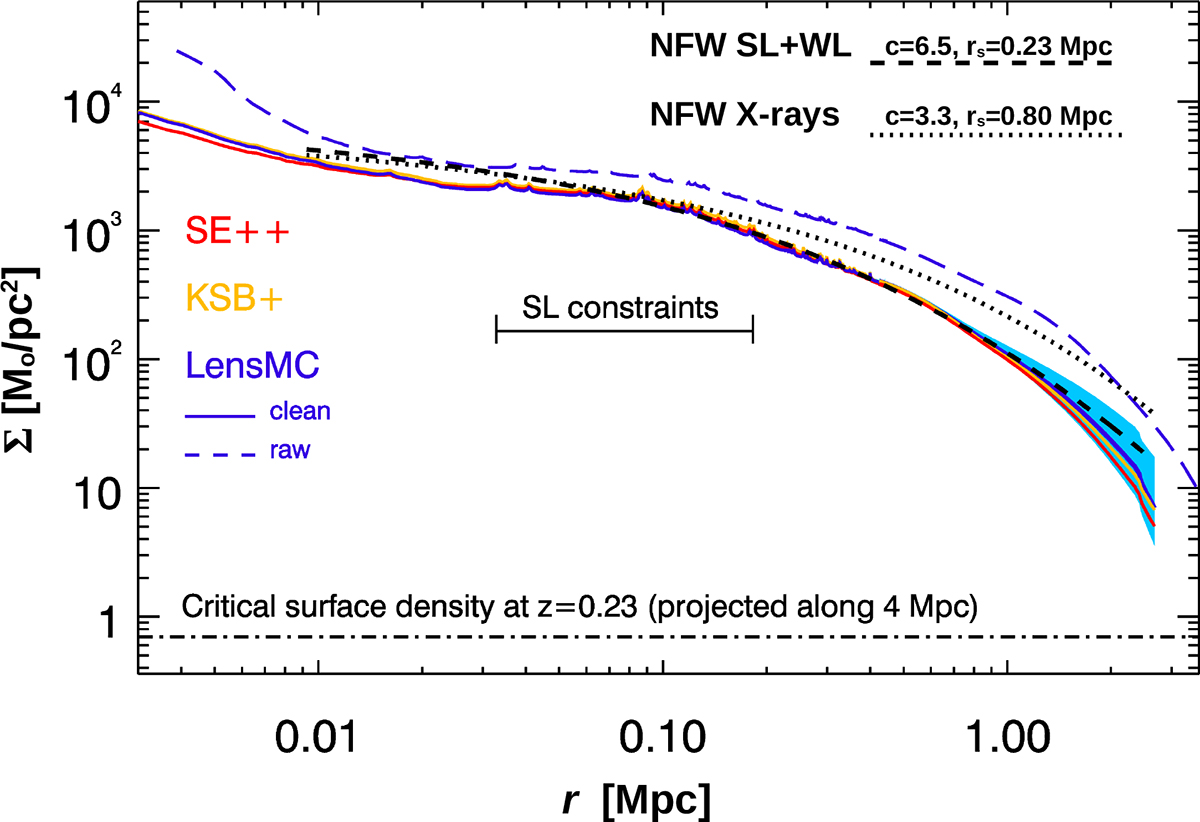
Fig. 3.
Download original image
Surface mass density (Σ) profiles as a function of radius (r) centred on the BCG for the three WL clean catalogues. Two NFW profiles are shown in black-grey. The dotted black line is the NFW derived from X-rays assuming hydrostatic equilibrium. The short-dashed black line is an NFW that fits the SL + WL model in the region that is best constrained by the SL + WL data. The light-blue band shows the 1σ variability in the LensMC profile when we change the initial guess in the SL + WL optimisation algorithm. The dashed dark-blue curve is the joint SL + WL solution when we use the raw LensMC in a larger field of view and with a minimal selection of objects (see Appendix A).
Current usage metrics show cumulative count of Article Views (full-text article views including HTML views, PDF and ePub downloads, according to the available data) and Abstracts Views on Vision4Press platform.
Data correspond to usage on the plateform after 2015. The current usage metrics is available 48-96 hours after online publication and is updated daily on week days.
Initial download of the metrics may take a while.