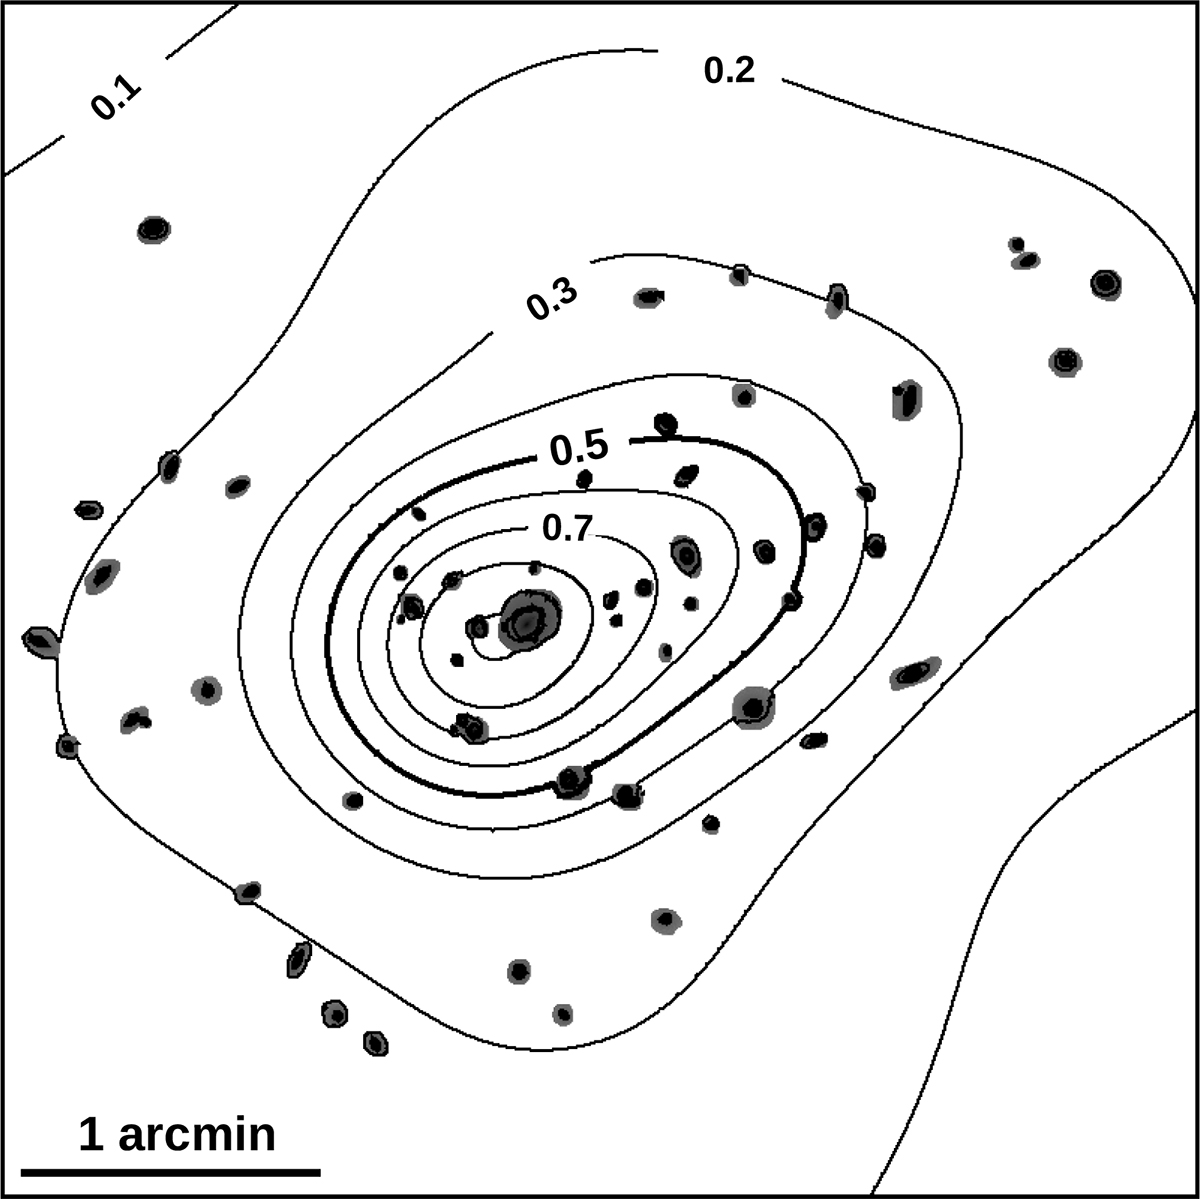
Fig. 4.
Download original image
Contours of the convergence at zs = 3. The member galaxies used in the model are also shown in black. The value of the convergence is indicated for some contours. We mark the value of κ = 0.5 with a thicker contour, which indicates the approximate position of the cluster critical curve at higher redshift. The value for the convergence in the last contour near the centre of the plot is κ = 1.06.
Current usage metrics show cumulative count of Article Views (full-text article views including HTML views, PDF and ePub downloads, according to the available data) and Abstracts Views on Vision4Press platform.
Data correspond to usage on the plateform after 2015. The current usage metrics is available 48-96 hours after online publication and is updated daily on week days.
Initial download of the metrics may take a while.