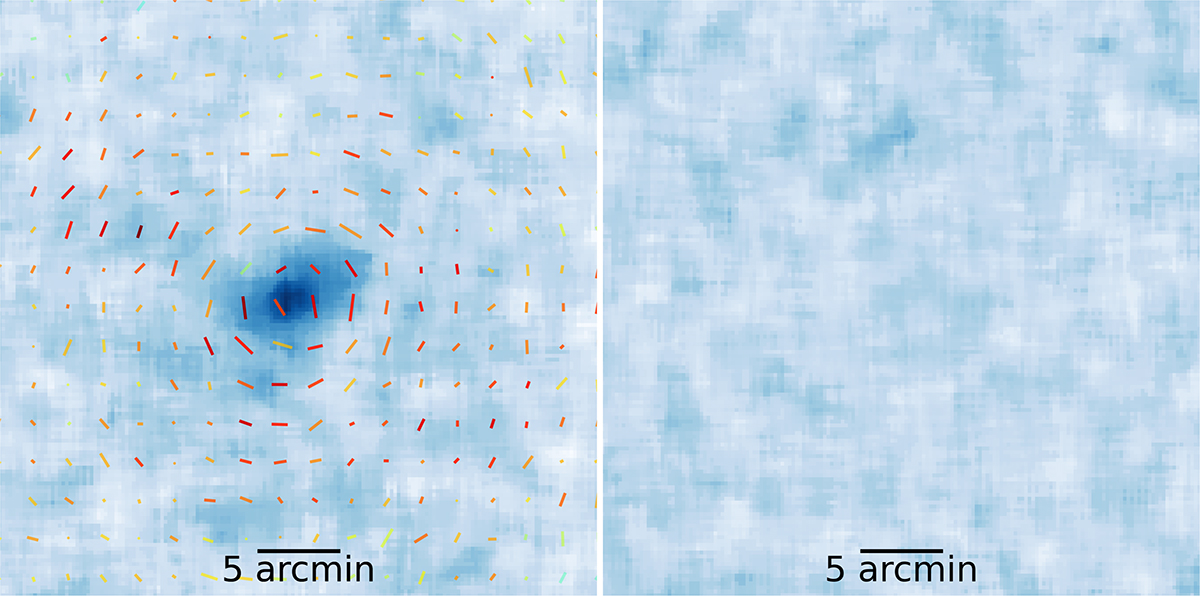
Fig. A.2.
Download original image
Convergence map reconstructed from the LensMC raw shear catalogue (without background selection and contamination correction), decomposed into E-modes (left) and B-modes (right). The alignment of the cluster mass in the SE-NW direction (left) is similar to the orientation found with the clean shear catalogue (Fig. 5). The absence of a clear B-mode signal in the right panel demonstrates the good control of systematic errors in this raw catalogue.
Current usage metrics show cumulative count of Article Views (full-text article views including HTML views, PDF and ePub downloads, according to the available data) and Abstracts Views on Vision4Press platform.
Data correspond to usage on the plateform after 2015. The current usage metrics is available 48-96 hours after online publication and is updated daily on week days.
Initial download of the metrics may take a while.