| Issue |
A&A
Volume 706, February 2026
|
|
|---|---|---|
| Article Number | A314 | |
| Number of page(s) | 19 | |
| Section | Interstellar and circumstellar matter | |
| DOI | https://doi.org/10.1051/0004-6361/202556532 | |
| Published online | 23 February 2026 | |
Photolysis of interstellar ice analogs containing ethanol: A new approach to forming C2H4O2 isomers
1
Sorbonne Université, CNRS, De la Molécule aux Nano-Objets: Réactivité, Interactions, Spectroscopies, MONARIS,
75005
Paris,
France
2
LUX, Observatoire de Paris, PSL University, Sorbonne Universités, CNRS,
75014
Paris,
France
★ Corresponding author: This email address is being protected from spambots. You need JavaScript enabled to view it.
Received:
21
July
2025
Accepted:
8
December
2025
Abstract
Context. The three most common of the eight isomers of C2H4O2 - methyl formate (CH3OCHO, MF), glycolaldehyde (CH2OHCHO, GA), and acetic acid (CH3COOH, AA) - are detected in various interstellar clouds, often with differing abundance ratios. Laboratory experiments simulating astrophysical ice conditions have successfully produced methyl formate and glycolaldehyde from methanolrich ices, but acetic-acid formation remains poorly understood, with only a few experimental successes. Current gas-grain chemical models can reproduce some observed abundances, whereas gas-phase models alone are insufficient.
Aims. The aim of this study is to investigate new formation pathways for C2H4O2 isomers through the vacuum-ultraviolet (VUV) irradiation of ethanol (CH3CH2OH) under astrophysically relevant ice conditions. By analyzing the photo-products formed in different environments - ethanol isolated in a neon matrix, in pure form, and mixed with molecular oxygen - we aim to identify mechanisms that could account for the observed abundances of these isomers in interstellar molecular clouds.
Methods. Fourier-transform infrared (FTIR) spectroscopy was performed on the ice analog before and after VUV irradiation at 3 K and at 5 K intervals from 10 to 300 K. The column density of each isomer in the ice was determined through quantitative FTIR analysis. As the temperature increased, desorption of the sample was monitored using a quadrupole mass spectrometer. The temperatureprogrammed desorption (TPD) profiles for each mass were used to corroborate the infrared (IR) results and to hypothesize the presence of specific species.
Results. Under conditions simulating astrophysical ice environments, we successfully formed the three isomers from CH3CH2OH:O2 ice irradiation. At 160 K, the abundance ratio of MF:GA:AA was determined to be 1.3:1:3.9. At this temperature, MF has already largely begun to desorb, and the associated abundance ratio does not represent the total quantity of MF formed. However, its detection at 160 K in the ice indicates that trapping is taking place in our experiment.
Conclusions. Our oxygenated ethanol ice irradiation experiment favors AA formation over GA, a result that can explain some interstellar medium (ISM) cloud observations.
Key words: astrochemistry / molecular data / molecular processes / methods: laboratory: molecular / ISM: molecules
© The Authors 2026
 Open Access article, published by EDP Sciences, under the terms of the Creative Commons Attribution License (https://creativecommons.org/licenses/by/4.0), which permits unrestricted use, distribution, and reproduction in any medium, provided the original work is properly cited.
This article is published in open access under the Subscribe to Open model. This email address is being protected from spambots. You need JavaScript enabled to view it. to support open access publication.
1 Introduction
The interstellar medium (ISM), and dense clouds in particular, are extremely rich in molecules. Today, according to the Cologne Database for Molecular Spectroscopy (CDMS)1, about 330 molecules have been detected in the ISM or circumstellar shells. Understanding the mechanisms and phenomena behind their formation has become an objective shared by two disciplines: astrophysics and chemistry. To achieve this goal, studies have focused on the detection of interstellar complex organic molecules (iCOMs; i.e., molecules containing at least six atoms, one or more of which are carbons; Herbst & Van Dishoeck 2009; Ceccarelli et al. 2017) and on quantifying their abundances (Belloche et al. 2025). Among these iCOMs, several belong to the same isomer group. The abundances of these isomers are determined with the aim of understanding the mechanisms behind the different distributions observed (Lattelais et al. 2009). The three main isomers of C2H4O2 – CH3OCHO (methyl formate, MF), CH2OHCHO (glycolaldehyde, GA) and CH3COOH (acetic acid, AA) – are widely detected in the ISM (Brown et al. 1975; Mehringer et al. 1997; Hollis et al. 2000). A fourth one, glycolaldehyde enol, (Z)-1,2-ethenediol (HOCH=CHOH), was detected toward the Galactic center for the first time by Rivilla et al. (2022). These isomers make it possible to constrain the physical and chemical conditions of the environment from which they emanate (Kaiser 2002).
These three isomers - CH3OCHO, CH2OHCHO, and CH3COOH - have therefore been detected in many regions of the ISM, but with very different abundances. Remarkably, of the three C2H4O2 isomers observed, only methyl formate is seen in almost all sources where O-bearing iCOMs are detected, while the other two are frequently undetected or close to the detection limit. There are, finally, a few sources where all three isomers are detected, such as IRAS16293-2422 A/B, Sgr B2(N), or sources in the multi-core NGC 6334I MM1 (Belloche et al. 2013; Xue et al. 2019; El-Abd et al. 2019; Manigand et al. 2020; Nazari et al. 2024). Of the other two isomers, GA and AA, GA is slightly more difficult to detect than AA. Indeed, AA is detected in several sources (e.g., in the NGC 6334I MM2 region and in Orion KL), whereas GA is not always detected (Favre et al. 2017; Pagani et al. 2017; Tercero et al. 2018; El-Abd et al. 2019), while there are only a few sources where GA is detected, while AA is not, such as NGC 1333 IRAS 4A and L1157-B1 (Lefloch et al. 2017; De Simone et al. 2020).
The C2H4O2 isomers are of particular interest in prebiotic chemistry. Indeed, GA is a precursor to ribose, which is essential for ribonucleic acid (RNA) structure. As for AA, it contains a motif present in glycine, an α-amino acid encoded by RNA messenger, and is thus considered its potential precursor.
To better understand the molecular formation mechanisms taking place in ISM clouds, the most abundant iCOMs have been studied in the laboratory, in numerous experiments designed to reproduce ISM conditions. These mechanisms are also studied numerically, using chemical models designed to reproduce the observed abundances. These models fall into two categories: those assuming a formation pathway for iCOMs on the grain surfaces (Shalabiea et al. 1998; Garrod et al. 2008), or in the gas phase (Loison et al. 2014; Balucani et al. 2015).
From a theoretical point of view, in the gas phase, Skouteris et al. (2018) worked on the formation pathways of GA and AA. They proposed CH3CH2OH as the gas-phase precursor and succeeded in recovering the known abundances of GA from some sources, but obtained an abundance of AA that was ten times too high. Recently, more sophisticated models have been created that consider both formation pathways (Garrod et al. 2022), but they tend to favor formation on the surface of icy grains.
From an experimental point of view, molecular formation routes in interstellar icy grain analogs have been studied by numerous authors, who have sought to reproduce ISM cloud conditions as closely as possible: in terms of pressures, temperatures and radiation sources. Laboratory studies use energetic processes involving electrons, heavy ions or UV photons in order to mimic cosmic rays (Gould & Salpeter 1963; Padovani et al. 2009) or UV photons from the interstellar radiation field (Draine 2010) or, more specifically, emissions from massive O/B stars (Ferrière 2001; Rautio et al. 2022). These laboratory experiments have already succeeded in forming various iCOMs, such as ethylene glycol ((CH2OH)2), methanol (CH3OH) from formaldehyde (H2CO) (Butscher et al. 2016), or isomers of C2H6O; e.g., ethanol (CH3CH2OH) and dimethyl ether (CH3OCH3) from the CH3OH:CH4 mixture (Bergantini et al. 2018a). The isomers of C2H4O2, have also been the subject of much experimental research, using solid CH3 OH as a precursor. The use of CH3OH has led several teams to successfully form large quantities of MF and sometimes small quantities of GA (Gerakines et al. 1996; Bennett et al. 2007; Maity et al. 2015; Leroux & Krim 2020). However, these studies did not lead to the formation of AA. Only a few icy mixtures of CH4:CO2 or CH3CHO:D2O enabled its formation, but they did not favor the formation of the other two isomers of interest (Bennett & Kaiser 2007a; Bergantini et al. 2018b; Kleimeier et al. 2020).
In addition to experiments involving UV photon (Gerakines et al. 1996; Butscher et al. 2016; Bergantini et al. 2018a) and electron irradiations (Bennett et al. 2011), laboratory studies (Andrade et al. 2013; Mejía et al. 2020, 2024) using heavy ions to irradiate astrophysical ices such as HCOOH, CH4:H2O, and H2O:CO:CH3OH, have succeeded in forming different reaction products of varying levels of complexity, such as CO, CO2, H2O2, HCOOH, CH3OH, and C2H5OH. More specifically, De Barros et al. (2011) showed that the irradiation of pure methanol ice at 15 K by fast heavy ions with energies ranging between 16 and 774 MeV mainly lead to the formation of H2 CO, CH2OH, CH4, CO, CO2, HCO, and HCOOCH3. Meanwhile, when investigating the irradiation of formic acid ice at 15 K with 267 MeV ions, Andrade et al. (2013) found that the most abundant chemical products formed were CO, CO2 , HCO and H2 O. Similar experimental studies carried out by Mejía et al. (2020, 2024) using swift heavy ions (40 MeV) to irradiate H2O:CH4 and H2O:CO:CH3OH ices at 15 K revealed that at high CH4 concentration relative to H2O, irradiation of H2O:CH4 ices would favor the formation of C2H8, HCO, H2CO, CO, CO2, H2O2, HCOOH, CH3OH, C2H5OH, and CH3CHO. In contrast, irradiated H2O:CO:CH3OH ices produced HCO, CO2, HCOOH, CH4, H2CO, H2O2, and C2H5OH with a possible formation of more complex organic molecules such as HCOOCH3, CH3COOH, and CH3COCH3.
Among the studies that succeeded in forming AA, two detected it only by mass spectrometry (Bergantini et al. 2018b; Kleimeier et al. 2020), which has a much lower detection threshold than IR spectrometry, implying a very low production of AA. The study that detects AA by IR (Bennett & Kaiser 2007a) uses the same icy mixture as Bergantini et al. (2018b), but with an electron dose typically 15 times greater. We therefore conclude that the investigated reaction pathways are possibly too unfavorable for AA formation to explain the abundances detected in the ISM.
To successfully form the C2 H4O2 isomers, we chose to use ethanol ice (CH3CH2OH), as it has the same chemical function as CH3OH and is widely detected, in gaseous form, in many ISM regions, though with a column density one or two orders of magnitude lower than that of CH3OH (Kou et al. 2025). To promote AA formation we chose to enrich our ethanol ice with molecular oxygen (O2 ), providing oxygen atoms free of carbon or hydrogen ones.
The interest in CH3CH2OH is confirmed by recent studies carried out with the James Webb Space Telescope (JWST) and its Mid-InfraRed Instrument (MIRI) (Wright et al. 2023), which revealed a significant quantity of this molecule in the icy grains of the ISM (Chen et al. 2023; Rocha et al. 2024). The interest of the icy CH3CH2OH:O2 mixture is also supported by the work of Wang et al. (2025). Indeed, they show that irradiation of CH3CH2OH:CO (1:2.5) ice leads to the formation of three C2H4O isomers, but none of the C2H4O2 isomers discussed here. This confirms our choice of using a pure oxygen source, O2 , to promote the formation of C2 H4O2 isomers.
Our purpose is to investigate favorable formation routes for C2 H4O2 isomers, and AA in particular, by studying ultraviolet vacuum irradiation (VUV) and heat treatment of CH3CH2 OH and CH3CH2OH:O2 ices. In our experiments, we reproduced the conditions of the ISM icy grains, which allow new species to be formed by recombination of radicals formed by VUV irradiation, whose mobility is enabled by the temperature rise of the medium (Ruffle & Herbst 2001). Our experimental results are intended to be compared with observational results to examine the proposed precursors and/or reaction mechanisms. We describe the experimental apparatus in Sect. 2, the results of the various experiences we conducted in Sect. 3, and we discuss the results in comparison with observations in Sect. 4. We summarize our findings in Sect. 5.
2 Experimental setup
In order to investigate the results from the thermal processing of irradiated CH3CH2OH:O2 ice, we carried out four different experiments. Each experiment is probed using infrared spectroscopy for the solid phase and mass spectrometry for the gas phase. These are listed below.
Exp 1: CH3CH2OH isolated in neon matrix and irradiated at 3 K.
Exp 2: pure CH3CH2OH ice formed at 10 K and heated from 10 to 300 K.
Exp 3: pure CH3 CH2OH ice formed and irradiated at 10 K and heated from 10 to 300 K.
Exp 4: CH3 CH2OH:O2 ice formed and irradiated at 10 K and heated from 10 to 300 K.
CH3CH2OH (99.9%) was purchased from Sigma-Aldrich, and O2 and Ne are purchased from Air Liquide. In all experiments, ice analogs were formed under ultrahigh vacuum of 10−10 mbar, on a mirror maintained at 3 K for the neon matrix isolation study and 10 K for ice deposition, using a closed-cycle helium cryogenerator (Sumitomo cryogenics F-70) where the temperature was controlled by a programmable temperature controller (Lakeshore 336). Ice irradiation was performed over 30 min with a VUV lamp with a total flux around 1015 photon cm−2 s−1 (Hamamatsu L10706 UV). Therefore, the total photon dose was approximately 1.8×10¹⁸ photon cm−2. According to the manufacturer, the total flux is 25% radiation at 121 nm (~10.3 eV) and 75% radiation at 160 nm (−7.7 eV). Before and after irradiation, samples were analyzed by a Fourier transform infrared (FTIR) spectrometer, in the transmission reflection mode with an incident angle of 8°. Mid-infrared reflectance spectra in the 5000-500 cm−1 spectral range were recorded. We repeated this measurement during the sample heating, in 5 K increments, to investigate the influence of the temperature on photo-induced reactions. The solid samples were deposited at low temperature, irradiated under these conditions, and then subjected to stepwise annealing. In addition, during the thermal heating, the desorbed species in the gas phase were analyzed by a quadrupole electron impact mass spectrometer in residual-gas-analyzer (RGA) mode. Mass spectra were recorded for a wide range of relevant masses between 15 and 75 amu. This enabled us to obtain a complete temperature-programmed desorption (TPD) profile for each desorbing species.
The first experiment was to list the fragments resulting from the ethanol irradiation while isolated in a neon matrix at 3 K CH3CH2OH∕Ne (8/500). The second experiment aimed to determine the temperatures associated with the structural change of pure CH3CH2OH ice and its desorption. Using the third experiment, photo-products of pure CH3CH2OH ice were investigated, guided by the CH3CH2OH∕Ne irradiation experiment. After photolysis, the pure ice was gradually heated to induce radical-radical reactions and promote larger photo-products. This sequence of irradiation and heating is designed to mimic the ISM cycle of matter. It reproduces the ideal system in which the very cold contents of the grains are irradiated by nearby newborn stars over a long period, before these same stars are sufficiently evolved to warm these grains, promote molecular reactions, and finally allow thermal desorption of the species formed. The fourth experiment, irradiation of CH3CH2 OH:O2 (1:5), is essentially the same as the third one. The addition of dioxygen allowed us to study ice closer to ISM ice, which is rich in oxygenated small molecules, but also to promote the formation of C2H4O2 isomers.
3 Results
3.1 CH3CH2OH+hν: Neon matrix isolation at 3 K
Figure 1a shows the IR spectrum of CH3CH2OH isolated in a neon matrix, at 3 K. The observed signals are in good agreement with previous neon and argon matrix isolation studies (Coussan et al. 1998; Zasimov et al. 2023). The IR signals at 3678 and 2986 cm−1 are due to OH and CH stretching vibrational modes, respectively. IR absorption bands between 1500 and 1350 cm−1 are associated with C-H scissoring and wagging modes, while the C-C-O stretching mode is located at 890 cm−1.
Table A.1 lists the main IR signals associated with the vibrational modes of ethanol trapped in different solid environments, namely CH3CH2OH isolated in neon and argon matrices, CH3CH2OH, and CH3CH2OH:O2 ices. The IR signals measured under our experimental conditions are compared with those measured in previous studies involving neon (Zasimov et al. 2023) and argon (Coussan et al. 1998) matrices and ethanol ice (Hudson 2017). Compared to previous matrix studies, the additional IR signals detected in our neon matrix isolation study are due to the formation of CH3CH2OH aggregates. In fact, Coussan et al. (1998) investigated a diluted argon matrix (CH3CH2OH∕Ar = 1/2800) to favor monomeric species, whereas in the present study, we opted to investigate a concentrated sample (CH3CH2OH∕Ne = 1.6/100) to increase the reactant and then the yield of photo-products following UV photolysis. The IR signals assigned to CH3CH2OH aggregates are in fact similar to those detected in the spectra of CH3CH2OH and CH3CH2OH:O2 ices. This is understandable, as aggregates are the intermediate products to form ices. Our experimental results characterizing ethanol in the solid phase are in good agreement with previous IR measurements of CH3CH2OH ice (Hudson 2017; Luna et al. 2018), which confirms our spectral attributions in pure and O2−enriched ices. However, it is worth noting that the spectral positions of the absorption bands of chemical species trapped in the solid phase show matrix-induced shifts depending on the environment in which the species are trapped. Consequently, the absorption bands of CH3CH2OH and CH3CH2OH:O2 astrophysical ices show spectral shifts due mainly to the presence of O2. Additionally, thermal and UV treatments may also alter the morphology of the ice and then the environment in which the reactants and photo-products are trapped. Under our experimental conditions, an analysis of the infrared spectra presented in this study shows spectral shifts induced by the neon matrix, ethanol ice, O2, the UV, and thermal processing.
Figure 1b shows the IR spectrum of CH3CH2OH isolated in a neon matrix, at 3 K after 30 minutes of UV irradiation. Comparing the IR intensities before and after irradiation, we notice that approximately 50% of CH3CH2OH is consumed, leading to the formation of various photo-products characterized by several new absorption bands that appear clearly at 3018, 2344, 2141, 1732, 1308, 1119, and 957 cm−1. One of the advantages of experiments carried out in a neon matrix is that all the photo-products are trapped, isolated from each other, and their spectral identifications can be performed using characteristic IR signals found in the literature in several matrix isolation studies.
As illustrated in Figure 1b, the features at 3018 and 1119 cm−1 are due to CH3CHO (Zasimov et al. 2022), CO2 is identified by its characteristic IR signal at 2344 cm−1 (Sandford et al. 1988; Isokoski et al. 2013), while the prominent signal at 2141 cm−1 corresponds to the CO molecule (Ewing & Pimentel 1961; Sandford et al. 1988; Lin et al. 2014). The IR signals detected at 1308 and 957 cm−1 can be assigned to CH4 and C2H4, respectively (Lin et al. 2014; Zasimov et al. 2022).
Figure 2, an expansion of Fig. 1 between 2280 and 1500 cm−1 , reveals that the UV photolysis of ethanol isolated in the neon matrix leads to H2CCO, HCCO, and CCO, detected at 2150, 2024, and 1963 cm−1, respectively (Zasimov et al. 2022). We also detect CH2CHOH at 1631 and 1666 cm−1, in addition to CH3CHOH observed at 1195 cm−1 (Rodler et al. 1984; Zasimov et al. 2024). All these detected species result from successive dehydrogenation of CH3CH2OH, as shown in Eq. (1). The dehydrogenation of CH3CH2OH also leads to CH3CHO, the more stable isomer of CH2CHOH, which is detected through numerous IR features at 3018, 2733, 2720, 1757, 1732, 1436, 1431, 1358, 1354, 1348, 1119, 1115, 771, and 513 cm−1 (Zasimov et al. 2022). Additionally, the detection of H2CO at 1744 and 1500 cm−1 (Pirim & Krim 2011; Asfin et al. 2021) on the one hand and that of CH4 at 1308 cm−1 (Wu et al. 2004) on the other, would suggest that the UV photolysis of ethanol isolated in neon matrix also leads to CH3 CH2OH fragmentation through the reaction pathway of Eq. (2). The first step of this mechanism is the C-C bond dissociation, leading to two radicals CH3 and CH2 OH, which would reorganize to form two more stable species: CH4 and H2CO. Similarly, the detection of H2O at 1599 cm−1 (Bouteiller & Perchard 2004) and C2H4 at 957 cm−1 (Lin et al. 2014), resulting from the UV photolysis of CH3CH2OH/Ne isolated, would suggest Eq. (3) as another reaction pathway for the photodissociation of CH3CH2OH. The first step of this mechanism is the C-O bond dissociation, leading to C2H5 and OH radicals that would reorganize into the two stable species C2H4 and H2 O, trapped in a neon matrix.
Table A.2 lists the main photo-products resulting from UV photolysis of CH3CH2OH isolated in a neon matrix, including secondary photo-products, such as CO, CO2 , CCCO, HCO, HOCO, and their assignments, based on literature data:
![Mathematical equation: \label{eq:1} \rm CH_3CH_2OH + h\nu \xrightarrow{} H + CH_3CHOH + h\nu \xrightarrow{} [..] \xrightarrow{} CCO](/articles/aa/full_html/2026/02/aa56532-25/aa56532-25-eq1.png) (1)
(1)
 (2)
(2)
 (3)
(3)
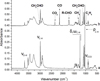 |
Fig. 1 IR spectra between 4250 and 500 cm−1 of CH3CH2 OH isolated in a neon matrix before (a) and after (b) UV irradiation. δ, ωC-H: bending modes; ρC-H: rocking modes; R-CHO : complex organic molecule with CHO group. |
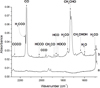 |
Fig. 2 IR spectra, between 2280 and 1500 cm−1, of CH3CH2OH isolated in neon matrix before (a) and after (b) UV irradiation. |
3.2 CH3CH2OH+hν : UV photolysis of CH3CH2OH ice at 10 K
We investigated the same photo-induced reaction CH3CH2OH+hy by irradiating ethanol ice at 10 K, the temperature usually accepted for dust within a dense molecular cloud (Goldsmith 2001). Figures 3b and 3c illustrate the IR spectra in the mid-infrared spectral region of ice formed at 10 K before and after UV irradiation.
Several photo-products resulting from ethanol ice photodissociation are detected and can be identified through their characteristic IR signals, namely CO2, CO, and C2H4 observed at 2340 cm−1, 2136 cm−1 (Bennett et al. 2007), and 956 cm−1 (Molpeceres et al. 2017), respectively. Many of these photoproducts trapped in ethanol ice were already detected in the previous experiment using the matrix isolation method. Among these photo-products CH3 CHO is observed through several absorption bands at 1715, 1352, 1124, 771, and 524 cm−1 (Hudson & Ferrante 2020), as shown in Fig. 3.
The absorption band, detected at 1715 cm−1 and attributed to CH3CHO, is broad and could contain other IR signals from organic species with a CHO functional group such as MF. Terwisscha Van Scheltinga et al. (2021) studied the IR spectra of MF in various astrophysical ice analogs. They showed that MF is characterized by three IR signals at 1722, 1167, and 913 cm−1, in MF:CH3 OH ice mixture. Bennett & Kaiser (2007b) identified MF as a reaction product upon irradiation of pure methanol ice, through the observation of three IR signals at 1718, 1159, and 914 cm−1 . Similarly, after UV irradiation of ethanol ice, we detected two IR signals at 1154 and 935 cm−1, which, associated with the absorption band observed at 1715 cm−1, would confirm the formation of MF under our experimental conditions.
The broad absorption band observed in Fig. 3b between 1700 and 1600 cm−1 shows an overlap of three IR signals located at 1678, 1648, and 1635 cm−1. Chuang et al. (2020) studied irradiation of C2H2:O2 ice and detected a broad signal between 1680 and 1630 cm−1, which is characteristic of a broad H2O signal, at 1635 cm−1 ; this overlapped signals of CH2CHOH, 1661 and 1639 cm−1. This assignment of CH2CHOH is confirmed by the detection of one signal at 834 cm−1, already seen at 823 cm−1 in our matrix experiment and assigned to CH2CHOH (Zasimov et al. 2022).
In addition to CO, CO2, CH3CHO, MF, CH2CHOH, and H2O, we also detected numerous unstable species such as HCO observed at 1845 cm−1 and HOCO, which are characterized by two IR signals at 1840 and 1214 cm−1 (Bennett & Kaiser 2007a; Butscher et al. 2015). We also detected the signal of the CH3CHOH radical at 1195 cm−1 (Zasimov et al. 2024), which is probably a reaction intermediate for the formation of the aforementioned CH2 CHOH molecule. IR signals detected after UV irradiation of CH3CH2OH ice at 10 K, together with their assignment, are listed in Table A.3. All of these attributions remain mere attempts. They are based on matrix-isolation studies and data from the literature. The IR signals of species trapped in a neon matrix are easily identifiable and show less overlap. In contrast, the IR spectra of astrophysical ices are difficult to analyse, mainly due to band overlap and spectral shifts caused by environmental effects. The present neon matrix isolation study identifies species such as HOCO, CH2CHOH, and CH3CHO through several IR signals. Therefore, we assume that photolysis of ethanol ice would also lead to the formation of these species, which can be identified by their characteristic intense IR signals, despite some of their secondary absorption bands being obscured by the strong IR absorption of ethanol ice.
The UV irradiation of CH3CH2OH ice was performed at 10 K and allowed us to store a significant amount of photo-products, mainly stable molecules and radicals. The thermal processing after irradiation is an important step in the synthesis of complex organic molecules via radical-radical recombination and radical-molecule reactions, both of which are important mechanisms of interstellar grain particles. We next investigated the thermal processing of CH3CH2OH ice formed at 10 K with and without UV irradiation.
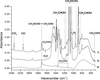 |
Fig. 3 IR spectra, between 2400 and 500 cm 1, of pure CH3CH2OH ice at 10 K before (b) and after (c) UV irradiation. Spectrum (a), taken from NASA cosmic ice laboratory (Hudson et al. 2009), shows the CH3CHO:H2O ice. |
3.3 CH3CH3OH+hν: thermal processing
Thermal treatment of irradiated CH3CH2OH ice was carried out by heating the ice from 10 to 300 K. Increasing the temperature leads to radical-radical and radical-molecular reactions. Consequently, all IR signals detected at 10 K and associated with radical species should disappear during the heating process and lead to the formation of new species. This evolution can be followed by the analysis of the IR spectra recorded at different temperatures.
Before investigating the effects of the thermal processing on CH3CH2OH ice formed and irradiated at 10 K, we studied the IR evolution of pure ethanol ice without UV irradiation. We gradually increased the temperature of CH3CH2OH ice between 10 and 300 K and recorded the IR spectra of the heated ice with temperature steps of 5 K. Figure 4 shows the IR spectra of CH3CH2OH ice at selected temperatures of 10, 110, 120, 160, and 165 K. At the start of heating, between 10 and 110 K, we do not observe any major change in the associated IR spectrum. However, from 120 K, a structural change takes place. The initial broad absorption bands observed at 10 K become narrow peaks: it is the transition from the amorphous to the crystalline structure of CH3CH2OH ice.
Ice desorption begins at 160 K and is characterized by the loss of intensity in the IR spectrum, which then corresponds to 60% of its initial IR intensity measured at 10 K. The IR signal disappears completely at 165 K, ending the desorption of CH3CH2OH. Burke et al. (2008) showed that CH3CH2OH ice undergoes a phase transition from amorphous to crystalline at 120 K and desorbs at 160 K, in good agreement with our experimental data.
Having characterized the thermal effects on pure CH3CH2OH ice between 10 and 300 K, we now investigate the influence of the thermal heating on irradiated CH3CH2OH ice. Figure 5 shows the IR spectra recorded, at selected temperatures, 10, 110, 120, 160 and 165 K. We highlight the spectral positions of the main photo-products detected after UV photolysis of ethanol ice at 10 K, namely CH3CHO, MF, CH2CHOH, C2H4 molecules, and CH3CHOH radicals.
The absorption bands detected at 1715, 1346, and 524 cm−1 and assigned to CH3CHO show a clear change in shape, and for the signal at 1715 cm−1 there is also a change of position from 1715 to 1724 cm−1. Signals become thinner at 110 K and disappear at 120 K, which suggests that the desorption of CH3CHO would occur between 110 and 120 K, which is coherent with the desorption temperature of CH3CHO measured by Molpeceres et al. (2022). The CH3CHO isomer CH2CHOH is detected via two signals at 10 K: 1678 and 1648 cm−1. The intensity of these two signals increases with temperature and becomes clearly discernible at 110 K. Unlike its isomer, CH2CHOH signals peak at 120 K and are still present at 160 K. This is also the case for H2O and C2H4, whose quantities increase as the ice heats up. We therefore deduce that thermal processing favors the C2H5 + OH reaction. Finally, as expected, the signal assigned to the CH3CHOH radical formed at 10 K disappears at 110 K.
Figure 5 shows that at 160 K, we still detect a residual signal, at 1724 cm−1, in the band attributed to the CHO group, which is a priori due to MF. A number of studies have investigated the desorption of MF, which starts around 110 K and ends around 130 K (Bertin et al. 2011; Burke et al. 2015). These works also showed that MF deposited on amorphous solid water (ASW) can continue to desorb up to 150 K, as it would be trapped in the bulk of the water ice (Bertin et al. 2011). Thus, as the desorption temperature of MF depends on the icy mixture, we conclude that the residual signal, at 1724 cm−1, could indeed belong to MF. This signal is still detectable at 160 K, implying that we are detecting MF trapped in CH3CH2OH ice, preventing MF from desorbing completely at temperatures of 110-130 K. This is probably due to the trapping of the MF in the bulk of the ethanol ice.
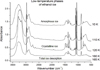 |
Fig. 4 IR spectra between 3600 and 500 cm 1, showing the evolution of pure CH3CH2OH ice formed at 10 K, during the heating process. |
3.4 CH3CH2OH+O2+hν: UV photolysis of CH3CH2OH:O2 ice at 10 K
Irradiation of CH3CH2OH ice at 10 K and subsequent heating between 10 and 300 K enabled us to identify only one of the C2H4O2 isomers: MF. GA and AA could not be observed under these experimental conditions. Several irradiation studies of interstellar ice analogs have been carried out to investigate the formation and evolution of these three C2 H4 O2 isomers. These studies have failed to form these isomers simultaneously. Many of these studies have succeeded in forming MF, some of them also show the formation of GA, but only three studies have supported the formation of AA. Experiments leading to the formation of AA involve the irradiation of oxygen-enriched icy mixtures. We therefore assume that increasing the proportion of oxygen in our icy analog will promote the formation of GA and AA, in addition to MF.
We performed exactly the same experiment as above, irradiating CH3CH2OH:O2 ice, also at 10 K. We chose to add O2 to enrich the CH3CH2OH ice with oxygen without increasing the proportion of other chemical elements such as H or C. In Sect. 4, we examine the astrophysical interest of O2 , compared with more conventional oxygen sources such as CO or H2O (Palumbo et al. 1999; Bennett & Kaiser 2007b). Figures 6d and e show the IR spectra of CH3CH2OH:O2 ice before and after UV irradiation, respectively. In order to investigate the influence of O2 on the photo-product distributions during the irradiation of CH3CH2OH:O2 ice, we added Figs. 6b and 6c to illustrate the IR spectra of pure CH3CH2OH ice before and after UV irradiation, respectively. Figure 6a shows a reference spectrum of CH3CHO:H2O, already presented in Figure 3a, the main photo-product of CH3CH2OH dehydrogenation with or without oxygen.
A comparison of Figs. 6e and 6c shows that several identical photo-products are formed in both irradiated ices, such as CO2, CO and CH3CHO, showing spectral shifts caused by environmental effects. New signals are observed Fig. 6e at 2278, 2232, 2107, 1548, and 702 cm−1 and are directly linked to the presence of oxygen molecules during the irradiation process. We identify the O2 signal at 1548 cm−1, present in the IR spectra of CH3CH2OH:O2 before and after UV irradiation and its photodissociation product, O3, is detected at 2107 and 702 cm−1 after irradiation (Krim et al. 2018). Signals at 2278 and 2232 cm−1 are assigned to 13CO2 and C3O2, respectively. The addition of O2 increases the amount of CO2 formed during UV irradiation, but not that of CO detected at 2139 cm−1 (Bennett et al. 2007). In fact, in the O2−enriched ice, CO2 formation is considerably enhanced to the extent that even the low IR signals of the bending mode of CO2 at 660 cm−1 (Bennett & Kaiser 2007b) and of the 13CO2 isotope are observed after UV irradiation of CH3CH2OH:O2 ice. All the IR signals detected after UV irradiation of CH3CH2OH:O2 at 10 K and their assignments are listed in Table A.4.
We see that some photo-products are favorably formed in the case of O2−enriched ice compared with pure ice. However, other photo-products are formed in smaller quantities or not at all when CH3CH2OH ice is enriched with oxygen. This is the case for CH3CHO, detected at 1348, 1129, 772, and 524 cm−1, and by the characteristic absorption band of the CHO group, at 1715 cm−1. Indeed, a comparison of Figs. 6e and 6c reveals fewer signals and, on average, less intense signals associated with this molecule. This comparison also reveals that the IR signals associated with the CH3CHOH radical and the C2H4 molecule are not detected after UV irradiation of O2−enriched ice. These molecules are probably involved in other reactions to form new complex organic molecules. This suggests that O2 would influence the reaction pathways during the photodissociation of ethanol.
A comparison of Figs. 6e and 6c also shows that UV irradiation of pure ethanol and O2−enriched ice leads to the formation of MF characterized by two IR signals at 1162 and 934 cm−1 (Gerakines et al. 1996; Bennett & Kaiser 2007b), in addition to the CHO absorption band at around 1715 cm−1 that is common to CH3CHO and MF. However, in the case of UV irradiation of CH3CH2OH:O2 ice, the band associated with the CHO group is much broader than in the pure ice experiment, ranging from 1780 to 1680 cm−1. Similar to the assignment made for pure ice, we assign the signals at 1635 cm−1 to H2O (Emtiaz et al. 2022) and signals at 1678 and 1648 cm−1 to CH2CHOH (Chuang et al. 2020). The formation of CH2CHOH is also confirmed by the detection of its signal at 835 cm−1.
Broad signal associated with the CHO group shows two shoulders on either side of the main absorption band, centered at 1715 cm−1. These two shoulders were absent in the pure ice experiment, in which we only confirmed the formation of CH3 CHO and MF. We therefore conclude that these two shoulders are due to the presence of at least one new molecule. Figure 6e shows the two shoulders, marked by two asterisks. The first shoulder between 1780 and 1740 cm−1 is tentatively assigned to GA which is expected to show an absorption signal around 1753 cm−1 (Hudson et al. 2005; Bennett & Kaiser 2007a). The second shoulder, between 1700 and 1680 cm−1, can be assigned to AA based on the results of Hudson et al. (2009) and Olivares et al. (2023), which showed that its IR signal is located around 1685 cm−1. Taking into account the spectral shifts caused by the solid environment in which the photo-products are trapped, the weak band detected at around 1232 cm−1 is assigned to GA (Hudson et al. 2005), but it may contain contributions from several chemical species that exhibit infrared signals in this region. These species include GA, MF, HOCO, and, potentially, HCOOH. In fact, the IR signal detected around 1700 cm−1 may also involve IR signal from HCOOH, which is a common product of the photolysis of astrophysical ices such as H2O:H2CO or H2O:CO (Bennett et al. 2011; Butscher et al. 2016). Previous studies (Andrade et al. 2013; Bennett et al. 2011) have shown that the characteristic IR signals of HCOOH are around 1700 and 1220 cm−1 . This suggests that HCOOH could be formed under our experimental conditions and their IR signals would be obscured by those of HOCO, MF and GA (Modica & Palumbo 2010; Hudson et al. 2005) around 1210-1230 cm−1 (C-O stretch), and those of CH3CHO, MF, GA, and AA (Andrade et al. 2013; Bennett et al. 2011) around 1700-1730 cm−1 (C=O stretch).
We note that the broad bands detected at 10 K complicate attributions by making them more uncertain. We therefore proceeded to the thermal processing of our sample, with the aim of stimulating molecular formation and confronting desorption temperatures observed with the ones from the literature.
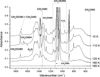 |
Fig. 5 IR spectra of pure, irradiated CH3CH2OH ice, between 1900 and 500 cm−1, during the heating process from 10 to 165 K. |
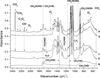 |
Fig. 6 IR spectra - between 2450 and 500 cm−1 - of CH3CH2OH:O2 ice at 10 K before (d) and after (e) UV irradiation versus CH3CH2OH ice at 10 K before (b) and after (c) UV irradiation. Spectrum (a), which is taken from the NASA cosmic ice laboratory (Hudson et al. 2009), shows the CH3CHO:H2O ice. Asterisks mark the position of the two shoulders, tentatively assigned to GA and AA. |
3.5 CH3CH2OH+O2+hν: thermal processing
The thermal processing of pure ethanol ice between 10 and 300 K has shown that crystallization of the ice occurs at 120 K and its desorption starts at 160 K. We show during the heating of the irradiated CH3CH2OH ice that at 160 K, only MF and CH3CH2OH are still detectable, under our experimental conditions. Similarly, we investigated the influence of thermal processing on irradiated CH3CH2OH:O2 ice. Figure 7 shows the IR spectra recorded at selected temperatures : 10, 110, 120, 160, and 165 K. IR signals assigned to O2 and O3 disappear at 110 K, which is consistent with the desorption temperatures of O2, 30 K and O3, 66 K found in Krim et al. (2018). However, CO2 signal at 660 cm−1 decreases during the thermal processing, but it remains visible up to 120 K. The desorption temperature of CO2 is known to be around 79 K (Fayolle et al. 2011) and its detection at higher temperatures in the solid phase shows that a significant proportion of CO2 is formed in the ice bulk and remains trapped until ethanol ice desorption.
Figure 7 shows that IR signals assigned to CH3 CHO remain detectable up to 120 K and disappear completely at 160 K. At 110 K, the shape of the broad signal assigned to the CHO group changes dramatically and reveals four signals at 1754, 1722, 1713, and 1698 cm−1, which can be assigned to GA, MF, CH3CHO, and AA. These spectral positions are in good agreement with those found in the literature: GA at 1757 cm 1 (Bennett & Kaiser 2007a), MF at 1718 cm−1 (Bennett & Kaiser 2007b), CH3CHO at 1715 cm−1 (Hudson et al. 2009), and AA at 1685 cm−1 (Hudson et al. 2009; Olivares et al. 2023), in addition to a possible formation of HCOOH (Bennett et al. 2011; Andrade et al. 2013).
The characteristic IR signals at 1713 and 524 cm−1 due to CH3CHO disappear at 120 K, while both absorption bands at 1754, and 1698 cm−1 - corresponding to GA and AA, respectively - increase between 110 and 120 K and are clearly discernible at 160 K. However, the signals at 1722, 1162, and 934 cm−1, which are related to MF, decrease between 120 and 160 K, but they remain detectable at 160 K. This detection at 160 K suggests that MF is favorably trapped in oxygenated ice compared with pure ice, where it was no longer detectable at 160 K. The infrared intensity of the weak band detected at around 1232 cm−1 and attributed to GA, which contains contributions from several chemical species such as MF, HOCO and, HCOOH, remains constant during the heating process. This indicates that, as the temperature increases to 160 K, the amount of GA rises, while the amounts of species such as MF, HOCO, and HCOOH decrease, probably due to desorption processes. As the three absorption bands at 1754, 1722, and 1698 cm−1 assigned to GA, MF, and AA, respectively, are clearly distinguishable in the IR spectrum recorded at 160 K, they were used to estimate the column density of these three C2H4O2 isomers. We did not consider the contribution of HCOOH to the column-density calculations performed at 160 K, since it is known that formic acid desorbs at temperatures below 160 K (Ioppolo et al. 2011; Chaabouni et al. 2020). As with HCOOH, reaction intermediates such as CH3OH and CH3OCH3 may also form during the photolysis and heating of CH3CH2OH and CH3CH2OH:O2 ices. Many of these species not detected with IR spectroscopy would be formed in small quantities and would desorb with ethanol or be involved in secondary reactions.
Irradiated CH3CH2OH:O2 ice heated at 165 K results in the disappearance of IR signal associated with MF while those due to GA and AA decrease considerably. Although the desorption temperatures of astrophysical ices depend on different parameters such as thickness, composition, and morphology of the ice, our results concerning the behavior of the IR signals of GA, MF, and AA - during the thermal processing - are consistent with desorption temperatures of these three isomers, which are reported in the literature. In this context, several studies have shown that the desorption temperatures of GA and AA, are higher than 160 K (Bertin et al. 2011; Burke et al. 2015), while that of pure MF can reach 135 K, and that of MF trapped in water ice can reach 150 K (Bertin et al. 2011). We show that MF is effectively trapped in ethanol ice and, although its desorption starts at 120 K under our experimental conditions, a considerable proportion is still detected at 160 K.
Figure 7 shows the spectrum from our oxygen-enriched ice irradiated at 165 K. Three IR signals can still be seen at 1698, 1040, and 885 cm−1. The first signal is due to AA, and the next two to CH3CH2OH (as seen in Fig. 1a). These signals were almost entirely absent from the pure ice experiment in Fig. 5 and totally absent for the unirradiated ice in Fig. 4. Thus, we hypothesize that the formation of oxygenated photo-products such as GA and AA would increase the desorption temperature of the resulting ice through the formation of hydrogen bonds.
Our results show that UV irradiation combined with the thermal processing of CH3CH2OH ice leads to the formation of MF, and the addition of O2 in the process promotes GA and AA production, in addition to amplifying MF formation. Using our IR data, we estimated the column density of the three C2H4O2 isomers in the solid phase at 160 K. Figure 8 shows an expansion of the IR spectrum of the irradiated CH3CH2OH:O2 ice heated at 160 K, in the 1825-1600 cm−1 spectral range. We chose to carry out column density measurements at 160 K, as this is the desorption temperature of CH3CH2OH. Below this temperature, the three signals associated with the C2H4O2 isomers are mixed with those of CH3CHO. Moreover, at this temperature the signals assigned to GA and AA are the most intense. This means that this temperature is optimal to produce these isomers.
However, though this high temperature means no CH3 CHO pollution, it is also well above the desorption temperature of MF. Thus, between 120 and 160 K, a significant amount of MF has desorbed. Consequently, the column density of MF obtained at 160 K does not correspond to its maximal amount. Since MF forms favorably from the extremely abundant CH3OH (Dartois et al. 1999; Bennett et al. 2007; Rocha et al. 2024), it only marginally depends on the abundance of CH3CH2OH, and this evaporation has no impact on our results.
Figure 8 shows the IR signal resulting from the C2H4O2 isomers in the 1830-1600 cm−1 spectral region, resulting from the CH3CH2OH:O2 UV experiment at three different temperatures. The purpose of this figure is to provide explicit deconvolution fits of the absorption band between 1800 and 1600 cm−1 at 10, 120, and 160 K, alongside the residuals and confidence intervals. The deconvolution was performed using the spectral fit method from OPUS software2. At each temperature, the experimental and modeled signals are labeled ‘a’ and ‘b’, respectively, while the residual, or the difference between the modeled and experimental data, is labeled ‘c’. The deconvolution fit at 120 K converges to four absorption bands, resulting in a very small residue relative to the intensity of the modeled signals. As shown in Fig. 8, these four bands are tentatively assigned to MG, GA, AA, and CH3CHO. Similarly, at 160 K, the deconvolution fit reliably converges to three curves, attributed to GA, MF, and AA. The situation is different at 10 K, and the deconvolution fit converges to three absorption bands, showing that the two dominant IR signals due to CH3CHO and MF overlap exactly due to site effects. The integrated band areas obtained as a result of our modeling are used to estimate column densities using the following equation adapted from Eq. (3) of Bennett et al. (2004):
 (4)
(4)
The correction factor cos(8°) accounts for the angle between the IR beam and the normal to the deposition mirror of our experimental setup, while the division by two corrects for the fact that the samples are observed twice in transmission-reflection mode. ∫I(ν) and A represent the integrated absorption band and the IR band strength, respectively. Table 1 lists the spectral positions of the vibrational modes considered for the column density calculations at 160 K, along with the corresponding band strengths of GA, MF, and AA. According to our experimental data, the main species is AA, with a column density of about 6.2×10¹⁶ molec cm−2, while GA and MF show almost the same column density of about 1.6×10¹⁶ and 2.0×10¹⁶ molec cm−2, respectively, giving a ratio of 1.3:1:3.9 for MF:GA:AA at 160 K. This similarity between MF and GA is only coincidental since most of the MF has started to evaporate above ~120 K.
We also calculated the column density of ethanol before and after irradiation of CH3CH2OH:O2 ice at 10 K, using the CH3CH2OH absorption band at 1090 cm−1, with its corresponding band strength of 7.35×10⁻¹⁸ cm molec−1 (Hudson 2017). As shown in Table 1, the amount of ethanol consumed during 30 min of irradiation at 10 K is approximately 2×10¹⁷ molec cm−2.
We calculated the column densities exclusively from the strongest C=O stretching bands of MF, GA, and AA. The secondary characteristic bands of these three species, ranging between 900 and 1400 cm−1, are weak and overlap with the strong absorption bands of ethanol. GA shows an absorption band at 1232 cm−1 . However, this band is extremely weak and is most likely mixed with IR signal of other molecules. Furthermore, it is located in a spectral region where the baseline is difficult to define. The situation is different for MF characterized by two secondary absorption bands at 1162 and 934 cm−1. The band at 1162 cm−1 is located in a region of the ethanol signal, making the estimation of its integrated area very uncertain. The band at 934 cm−1 appears to be located in a favorable part of the spectrum where the baseline is relatively flat. Therefore, it could provide an order of magnitude for the amount of MF in our ice. Since we were unable to perform column density calculations for GA and AA using secondary absorption bands, we chose not to include the MF calculation performed for the secondary band located at 934 cm−1. To estimate the error associated with the uncertainty in the band strength values, we used a new set of band strengths for the C=O stretching bands derived from theoretical calculations (Bennett et al. 2007; Rocha et al. 2024) to deduce a new distribution MF:GA:AA ratio. The results of these calculations are presented in the second part of Table 1, with a new ratio distribution of 1.2:1:2.5 for MF:GA:AA, and showing an error of less than 40%. The resulting error is much greater than the error in calculating the integrated area, which is of only a few percent. However, taking these uncertainties into account, we note that at 160 K, the quantities of MF and GA are still identical, while that of AA remains higher.
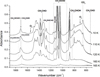 |
Fig. 7 IR spectra - between 1900 and 500 cm 1 - of the irradiated CH3CH2OH:O2 ice during the heating process. GA is presumably detected at 1754 cm−1 (Hudson et al. 2005) and AA at 1698 cm−1 (Olivares et al. 2023). |
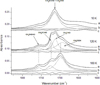 |
Fig. 8 IR spectra of irradiated CH3CH2OH:O2 between 1825 and 1600 cm−1 at 10, 120, and 160 K. Spectrum (a): Experimental data. Spectrum (b): Combination of the different modeled signals (dotted lines). Spectrum (c): Difference between data and model; i.e., the residual. |
Photo-products from CH3CH2OH+O2+hν reaction: UV irradiation of ethanol-dioxygen ice at 10 K.
3.6 Temperature programmed desorption
Using IR spectroscopy analysis, we show that three isomers of C2H4O2, MF, GA, and AA are formed during the heating of the irradiated CH3CH2OH:O2 ice between 10 and 160 K. The same experiment carried out without oxygen leads to only small amounts of MF. To confirm IR results, we investigated temperature-programmed desorption experiments using a quadrupole mass spectrometer (TPD-QMS) during the heating of the samples corresponding to the three experiments we discussed above: pure CH3CH2OH and irradiated CH3CH2OH and CH3CH2OH:O2 ices.
The mass signal of the parent fragment of C2H4O2 corresponds to m/z = 60. Analysis of this signal as a function of temperature, combined with the known order of desorption of the isomers, enabled us to characterize the different stages of desorption of MF, GA, and AA. Regarding the desorption temperature of these complex organic molecules, Bennett et al. (2007) and Bertin et al. (2011) characterized the desorption temperature of MF around 113 K and showed the dependency of this temperature on the thickness and the composition of the astrophysical ices. Similarly, Bertin et al. (2011) and Burke et al. (2015) measured desorption temperatures of GA and AA of around 160 and 169 K, respectively. On the other hand, the recent study of Olivares et al. (2023) mentioned that the desorption temperature of AA is higher and may reach 189 K. Regarding the mass spectra analysis, one has to note that the parent fragment of propanol (CH3CH2CH2OH) also corresponds to m/z = 60 and can be favorably formed under our experimental conditions, mainly during the UV irradiation of CH3CH2OH ice. The desorption temperature of CH3CH2CH2OH is around 155K (Qasim et al. 2019).
Based on the experimental data provided in the literature, we analyzed TPD spectra of pure and irradiated CH3CH2OH and CH3CH2OH:O2 ices, corresponding to mass signal at m/z = 60. Figure 9a shows the non-detection of mass m/z = 60 in the pure CH3CH2OH ice heating experiment. In this experiment, the largest mass fragment is m/z = 45, corresponding to the desorption of CH3CH2OH.
Figure 9b shows a mass signal at 118 K in good agreement with the MF desorption temperatures given in the literature. However, we do not detect m/z = 60 mass signals at temperatures higher than 140 K, which excludes the possibility of the formation of CH3CH2CH2OH, GA, and AA during the UV irradiation of pure CH3CH2OH ice.
The absence of CH3 CH2 CH2 OH desorption in the pure ice experiment, combined with its non-detection in the IR spectra, suggests that the formation of this species is not favored under our experimental conditions. This lack of detection further implies that CH3CH2CH2OH is unlikely to form efficiently in the oxygen-enriched ice experiment. Consequently, the observed signal at m/z = 60 in the latter experiment can be assigned exclusively to isomeric forms of C2H4O2.
Figure 9c shows the mass signal m/z = 60 for the irradiated CH3CH2OH:O2 ice experiment. In Fig. 9c, we continue to detect a desorption signal after 165 K and up to 230 K. Our infrared data, meanwhile, show only a few extremely weak bands at 165 K; this is due to the desorption of almost all the ethanol in our sample. Detection after 165 K (by mass spectrometry) is explained by the difference in sensitivity of these two methods. Mass spectrometry has a much lower detection threshold than infrared spectrometry. In addition, we note that Fig. 9c shows an extremely noisy signal before 100 K, due to the pollution of the measurement system caused by desorption of the large amount of molecular oxygen. Despite this very high noise level, we detect a signal at 118 K and, by comparison with Fig. 9b, we assign it to MF.
Figure 9c also shows a broad desorption signal between 130 and 230 K, which should, according to IR analysis, partly correspond to the GA and AA desorption signals known to desorb between ~ 150 and ~ 190 K.
This broad desorption signal has two maxima: the first at 164 K and the second at 200 K. From the IR results, we know that at 160 K both MF and GA remain in the icy sample. Knowing that MF desorbs at 118 K, we assume that the desorptions between 130 and 150 K correspond to the volcano desorption (Smith et al. 1997; Ayotte et al. 2001; Burke et al. 2015) of part of the residual MF caused by the phase change of the ethanol ice. From 150 K, it is very likely that the GA also begins to desorb, thereby contributing to the increase in the m/z=60 mass signal. The first maximum at 164 K has a poor signal-to-noise ratio (S/N) and corresponds to the maximum of ethanol desorption, to within a few Kelvin. This signal at 164 K is also close to the known GA desorption temperature and could therefore be assigned to the latter. Thus, this desorption could be caused either by GA desorption alone or by the co-desorption of the isomers of interest with ethanol.
Depending on the previous studies’ results, AA is found to desorb between 160 and 190 K. Thus, it is difficult to assert that AA desorption explains the signal increase up to 200 K. Furthermore, the signal after 200 K is still present and decreases slowly up to 230 K, making it even harder to assign these desorptions to AA.
To explain the increase in the desorption signal up to 200 K and its slow decrease beyond this point, a possibility would be the co-desorption of the C2H4O2 isomers with ethylene glycol ((CH2OH)2), which is known to desorb at 200 K (Maity et al. 2014). However, the parent fragment of (CH2OH)2, at m/z = 62, was not detected in our experiment. Consequently, this desorption is due to another species. One possibility, raised in Maity et al. (2014, 2015), is the fourth isomer of C2H4O2: ethene-1,2-diol (HOCH=CHOH). This isomer has already been detected, by PI-ReToF mass spectrometry coupled with TPD measurements, during the thermal processing of irradiated ice mixtures of CH3OH and CH3OH:CO (Maity et al. 2014; Kleimeier et al. 2021) with a desorption temperature of 210 K. It is therefore possible to assume that the desorption signal between 200 and 230 K in the oxygen-enriched ice experiment comes from the desorption of this fourth isomer. This assumption is examined in details in the next section.
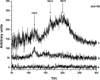 |
Fig. 9 TPD spectra of molecular mass m/z = 60 during the thermal processing: (a) pure CH3CH2OH experiment; (b) irradiated CH3CH2OH experiment; and (c) irradiated CH3CH2OH:O2 experiment. |
4 Discussion
Combining matrix isolation studies carried out at 3 K and UV-thermal treatments on pure CH3CH2OH and mixed CH3CH2OH:O2 astrophysical ices formed at 10 K, we show that the presence of O2 leads to the formation of three C2H4O2 isomers: MF, GA, and AA. We used IR analysis at 160 K to calculate the abundance ratios for MF:GA:AA equal to 1.3:1:3.9. In the solid phase at 160 K, acetic acid is more abundant than methyl formate and glycolaldehyde, which have similar abundances. The experimental ratio GA:AA, derived from oxygenated ethanol ice irradiation, can be compared with those observed in different regions of the ISM. The MF case is special because its formation from CH3CH2OH is less likely than from CH3OH. Therefore, the MF experimental ratio cannot correspond to those observed.
In our oxygenated experiment, the study of desorption products by mass spectroscopy shows a decreasing desorption signal of mass m/z=60, between 200 and 230 K, which could not be assigned to the molecules detected in IR. We show that this signal could be due to the presence of the fourth C2H4O2 isomer, HOCH=CHOH, rather than to the co-desorption of C2H4O2 isomers with (CH2OH)2 , since (CH2OH)2 was not detected by infrared and mass spectroscopy in our experiments.
Danho et al. (2023) studied the IR spectrum of HOCH=CHOH isolated in an argon matrix and showed that most of the IR signals characterizing HOCH=CHOH overlap with those of CH3CH2OH. Consequently, IR characterization of HOCH=CHOH trapped in ethanol becomes infeasible under our experimental conditions. HOCH=CHOH has been already formed upon irradiation of CH3 OH and CH3OH:CO ices and detected using only mass spectrometry (Maity et al. 2014; Kleimeier et al. 2021). Thus, this molecule is an excellent candidate to explain the high-temperature desorption signal detected in the CH3CH2OH:O2 irradiation experiment.
Furthermore, we note that several products formed in our O2−enriched experiment have higher desorption temperatures (CH3CHO, CH2CHOH, MF) than those observed in our pure ice experiment. One way of explaining this result is to look at the work of Khan et al. (2025). This team has shown that the trapping of H2O mixed with (CH2OH)2 is effective in ice, at temperatures well above that known for its desorption. According to this team, the hydrogen bonds between these two species are at the origin of this trapping phenomenon. They also observe a slightly higher desorption temperature for the mixture of (CH2OH)2 and H2O than for pure (CH2OH)2.
In the case of the O2-enriched experiment, it can be considered that hydrogen bonds are responsible for the higher desorption temperatures of several products (detected by IR) such as CH3CHO, CH2CHOH, MF, and can also partly explain the desorption of the m/z=60 mass signal between 200 and 230 K. Indeed, the temperature of these desorptions is too high to be solely due to hydrogen bonding between the C2H4O2 isomers. We therefore cautiously conclude that these desorptions, between 200 and 230 K, could be caused by both codesorption with HOCH=CHOH and the presence of hydrogen bonds between the C2H4O2 isomers formed.
As part of our study of C2H4O2 isomer formation, we investigated the impact of oxygen-enriched ices. We chose the pure oxygen source O2 to limit the formation of photo-products to C2H4O2 isomers with two oxygen and carbon atoms. From an astrophysical point of view, we wonder whether the use of CH3CH2OH:O2 ices might correspond to the composition of ISM ices. Oxygen is the third most abundant atom after H and He, and from gaseous O it is possible to form O2. This molecule has been widely sought in known molecular clouds, although it is difficult to detect as it has no electric dipole moment and must be observed outside the Earth’s atmosphere. Numerous unsuccessful observations took place (Olofsson et al. 1998; Pagani et al. 2003) before O2 was detected (Larsson et al. 2007; Goldsmith et al. 2011). The amount of O2 detected was much lower than predicted by gas-phase chemistry models (Pagani et al. 2003; Goldsmith et al. 2011). The upper limits - resulting from nondetection - and the low abundances obtained when O2 is detected led Goldsmith et al. (2011) to conclude that most of the O2 contained in ISM clouds must be in icy form, and therefore it is undetectable until the grains have been heated sufficiently to allow its desorption. However, in the study carried out by Gibb et al. (2004) to characterize the icy grains in ISM clouds, O2 was not detected.
On the other hand, oxygenated species such as H2O, CO, CO2 and CH3 OH are found in several sources, with H2O detected in all the sources studied by Gibb et al. (2004) or in the various works of D.C. Whittet (e.g. Whittet et al. 2013, and references therein). Thanks to the JWST having a higher spectroscopic resolution and a higher sensitivity than the previous space near- and mid-IR telescopes, the detailed composition of the icy grains can be explored. As in the pre-JWST studies, H2O remains the main component of the icy grains (e.g. Van Gelder et al. 2024; Rocha et al. 2024), but contrary to Whittet et al. (2013), Van Gelder et al. (2024) find that CO2 is the second most abundant oxygen source after H2O in icy grains, while CO is found to be much less abundant. H2O remains the main oxygen reservoir in the ISM ices. This result confirms the gas-grain model of Bergin et al. (2000), which predicts that most of the oxygen is trapped as water ices. In their inclusive study of water in the ISM, Van Dishoeck et al. (2021) concluded that certain pre-stellar conditions are favorable for oxygen storage as solid H2O. We also note that the data provided from the Rosetta mission show a much higher abundance of icy O2 than expected in comet 67P (Taquet et al. 2018; Rubin et al. 2019). Thus, these unexpected O2 abundances, studied by Taquet et al. (2018) and Van Dishoeck et al. (2021), show that initial conditions in the parent cloud can alter the abundance ratios of gaseous and icy oxygen species. It is therefore difficult to conclude whether or not O2 is present in the ices of ISM clouds. Two other oxygen-rich species are the H2O2 and O2H molecules that have been detected in the ρ Oph cloud (Bergman et al. 2011; Parise et al. 2012). In ρ Oph these molecules are four orders of magnitude less abundant than methanol in Orion, but this might be due to their fast reactions with other species due to their high reactivity. Their gas-phase destruction mechanisms also remain still unknown (Du et al. 2012). These two molecules are formed on the icy grains of the ISM and could therefore be interesting sources of oxygen to replace or complement O2 . The present study shows the important role of oxygen atoms in the formation of complex organic molecules in the ISM. However, in order to better reflect the diversity of the ISM ices, other experiments should be performed using different oxygen sources such as H2O, CO2, CH3OH, and H2O2 with the aim of quantifying the impact of each oxygen source on the formation of C2H4O2 isomers.
C2H4O2 isomers have been widely searched for and detected in the ISM. In an attempt to explain their abundances, and more generally the abundances of different isomers, the minimum energy principle (MEP) is frequently invoked. This corresponds to the following postulate: the most stable isomer is the one most present in the ISM, and the abundances of its less stable isomers are directly related to the energy ratio between the different isomeric forms (Lattelais et al. 2009). This postulate works for a number of species, such as HOC+, HC3N, and HNCO, which show the greatest energy differences among their most stable isomers. For some species, it fails; this is the case for C2H4O2 isomers. According to the Lattelais et al. (2009) calculations, the most stable isomer is AA (0 kcal/mol), followed by MF (+17 kcal/mol) and GA (+27 kcal/mol). However, MF is the most abundant in the ISM by far.
The three C2H4O2 isomers have been searched for in various ISM clouds, mainly in gaseous form, but also more recently in icy form using the JWST infrared spectrometer. The results of different surveys are summarized in Table 2, showing the isomeric abundance ratios and the interstellar regions where the three isomers were detected. The abundance ratios were calculated on the basis of estimated column densities, including upper limits marked by ≤.
From our experimental measurements, the MF:GA:AA abundance ratio is equal to 1.3:1:3.9 at 160 K, suggesting that the most abundant species in solid phase is AA at that temperature. These experimental results can be compared with observational data from ISM clouds. To do this, it is important to supplement with previous results on the formation of C2H4O2 isomers, as CH3 CH2OH is not the only precursor of these isomers.
MF is known to be favorably formed from CH3 OH, which is far more abundant in the gas and ice phases than CH3 CH2OH (Dartois et al. 1999; Bennett et al. 2007; Bennett & Kaiser 2007b; Rocha et al. 2024; Kou et al. 2025). Additionally, we note that GA can also be formed from CH3 OH or oxygenated CH3 OH. A priori, it is more difficult to form GA than MF, as some CH3 OH irradiation experiments failed to form GA (Gerakines et al. 1996), whereas they did form MF. Experiments using CH3 OH:CO made GA formation more likely than pure ice experiments (Bennett et al. 2007; Bennett & Kaiser 2007b), but other CH3OH:O2 irradiation experiments failed to form GA (Leroux & Krim 2020). Therefore, CH3 OH allows MF to form favorably and can also form GA.
In our experiment, we obtained the abundance ratio MF:GA:AA, in oxygenated ethanol ice. The ratio obtained for MF cannot match the values observed in the ISM, in which MF is formed from methanol. The ratio obtained for AA shows that it is the most abundant of the isomers, under our experimental conditions. We determined the abundance of GA at 160 K, when its desorption had already begun. This temperature corresponds to the very beginning of its desorption, and we therefore consider our GA:AA ratio to be a first approximation of the isomeric distribution in our experiment.
In the ISM, the gas content of molecular formation regions has been extensively probed by (sub)millimeter spectroscopy. The brightness of these gases is dominated by emission from the hottest regions, where the icy species contained in the grains have mostly desorbed. We assume that the gas-phase ratios correspond to the solid-phase ratios on the grains. Under this assumption, the ethanol reaction pathways investigated in our experiment predict more AA than GA. On the contrary, in a methanol-rich, ethanol-poor environment, GA is favored over AA since there is no route from methanol to AA. This difference in chemical content between methanol-rich and ethanol-rich environments could be due to the age of the source and/or the efficiency of its heating.
The MF:GA:AA ratios, belonging to 25 sources, presented in Table 2 are derived from different observations and therefore do not have the same measurement uncertainties. However, if we consider an optimistic 50% error on the deduced column-density values, this uncertainty is greater than the error in the column density caused by poor knowledge of the partition functions of the molecules, which varies between 9 and 43% (Carvajal et al. 2019). It remains optimistic because we do not know the errors associated with the observation. Considering this 50% error of the 25 sources shown in Table 2, half have AA abundances greater than those of GA, corresponding to the abundances found in our experiments. This implies that reactions in an ethanol-rich environment could be very frequent. However, many phenomena and mechanisms could also explain this GA depletion that was already reported by several authors (Pagani et al. 2017; El-Abd et al. 2019; Mininni et al. 2020).
In Table 2, several sources show a GA:AA ratio well below that predicted in our experiments, such as V883 Ori, W51/e2 and, NGC 6334I MM1-v, with ratios of down to 0.15:1. In addition, whenever a source is close to a HII region, its GA abundance is lower than its AA abundance. The HII region could be at the origin of a preferential destruction of GA. These results suggest that GA destruction mechanisms could also exist in these sources. An attempt to explain this depletion for the sources inside NGC 6334I-MM2 is given by Shope et al. (2024) based on the work of Garrod et al. (2022); moreover, it proposes a pathway of GA destruction in ice via H abstraction by another H-atom that is favorable in dense environments and/or has experienced a long time lapse at temperatures corresponding to the desorption of H2O from grains.
In the present study, we show that the combination of the IR and mass data suggests a possible reaction pathway for the formation of MF, GA, and AA, with a distribution showing an uncertainty of approximately 40%. It should be noted that only additional experiments using photoionization time-of-flight mass spectrometry (PI-ReToF-MS) would provide more information on the distribution of these three isomers. Previous studies on energetic processes of astrophysical ices containing CH3OH and CH3CHO have been conducted to investigate the formation of MF and GA (Gerakines et al. 1996; Bennett et al. 2007; Maity et al. 2015; Leroux & Krim 2020) using CH3OH as a precursor, and AA formation using CH3 CHO as a precursor (Bennett & Kaiser 2007a; Bergantini et al. 2018b; Kleimeier et al. 2020). Our experimental results on the photolysis of interstellar ice analogs suggest that the three isomers would be formed using ethanol and oxygen as precursors. Photolysis of CH3CH2OH and CH3CH2OH:O2 ices associated with neon matrix isolation studies allowed us to identify reaction intermediates such as HCO, HOCO, H2CO, and CH3CHO, which are similar to those observed in previous experiments involving either CH3OH or CH3CHO. This shows that the simultaneous formation of MF, GA and, AA would require either CH3OH and CH3CHO as precursors or ethanol mixed with oxidants, such as O2, as proposed in the present study. However, additional experiments should be carried out with oxidants more relevant to astrophysics, such as H2O, CO2, and CO, in order to test the robustness of the pathway we propose under realistic ice compositions.
As a first approximation, we assumed that the abundance ratios in the solid phase are the same in the gas phase. This approximation neglects the temperature-dependent desorption phenomenon, whereas the isomers of interest do not desorb at the same temperatures. The temperature of the environment could therefore have an impact on the observed abundance ratios. However, the temperatures determined by the various authors, assuming thermodynamic equilibrium, do not appear to influence the abundances of the different isomers. The question of the impact of temperature therefore remains open and would be interesting to explore in a specific study. Results in the gas phase confirm that MEP hypothesis is not verified: in all cases, MF is the most abundant isomer. Therefore, contrary to what MEP predicts, reaction pathways and precursor abundances have a significant influence on the abundance of isomers in a region.
New information on the icy content of the ISM, obtained by the JWST and its MIRI spectrometer, makes it possible to free ourselves of desorption phenomena and thus more easily obtain information comparable with experimental results. This new method of investigation adds to the various multidisciplinary approaches already in place to further our understanding of the abundance ratios of the C2H4O2 isomers.
MF:GA:AA isomeric abundance ratio in the ISM compared to our experimental data.
5 Conclusion
Our study focused on the experimental investigation of the formation pathways of C2H4O2 isomers in interstellar ice analogs of CH3CH2OH. We carried out three experiments irradiating this molecule in a neon matrix, both pure and mixed with oxygen. Only the CH3CH2OH:O2 irradiation experiment resulted in the formation of the three isomers of interest - MF, GA, and AA - in quantities sufficient to be detected by IR and mass spectroscopies. The other two irradiation experiments, pure and in a neon matrix, enabled us to learn about typical photoproducts, including some radical species. Our pure CH3CH2OH irradiation experiment only led to the formation of MF.
Our experiments show that GA and AA are formed from a mixture of oxygen and photo-products of CH3CH2OH. This new formation pathway is very interesting for explaining the abundances of AA, as CH3aCH2OH and small oxygenated molecules such as H2O and CO are abundant in ISM ices. In order to verify these reaction pathways, it would be interesting to reproduce our experiments with different oxygenated ISM molecules: H2O, H2O2, CO2, and CH3OH.
We obtained an experimental abundance ratio, MF:GA:AA, of ~ 1:1:4 at 160 K in the ice. At this temperature, we know that MF is supposed to have finished desorbing and GA to have begun. Thus, the ratio value for MF, obtained at 160 K, is not representative of the actual amount formed before the start of desorption, while the ratio value for GA is probably still a good approximation as the desorption remains limited.
In the oxygenated ice experiment, molecules are detected well after their known or observed desorption temperatures in pure ice. This trapping phenomenon occurs for various species. It is thought to be due to the formation of hydrogen bonds, which effectively trap many molecules, including C2H4O2 isomers. This phenomenon could also occur in the icy grains of the ISM, and could lead to abundance ratios in the gas phase that are very different from those predicted by models. This underlines the importance of the parameters - kinetic temperature and composition of the icy grains - in correctly interpreting the gas-phase abundance ratios for each source.
References
- Andrade, D. P. P., De Barros, A. L. F., Pilling, S., et al. 2013, MNRAS, 430, 787 [Google Scholar]
- Asfin, R., Bulychev, V., Buturlimova, M., & Tokhadze, K. 2021, J. Mol. Struc., 1225, 129080 [Google Scholar]
- Ayotte, P., Smith, R. S., Stevenson, K. P., et al. 2001, J. Geophys. Res.: Planets, 106, 33387 [Google Scholar]
- Balucani, N., Ceccarelli, C., & Taquet, V. 2015, MNRAS, 449, L16 [Google Scholar]
- Belloche, A., Müller, H. S. P., Menten, K. M., Schilke, P., & Comito, C. 2013, A&A, 559, A47 [NASA ADS] [CrossRef] [EDP Sciences] [Google Scholar]
- Belloche, A., Garrod, R. T., Müller, H. S. P., et al. 2025, A&A, 698, A143 [NASA ADS] [CrossRef] [EDP Sciences] [Google Scholar]
- Bennett, C. J., & Kaiser, R. I. 2007a, ApJ, 660, 1289 [NASA ADS] [CrossRef] [Google Scholar]
- Bennett, C. J., & Kaiser, R. I. 2007b, ApJ, 661, 899 [Google Scholar]
- Bennett, C. J., Jamieson, C., Mebel, A. M., & Kaiser, R. I. 2004, Phys. Chem. Chem. Phys., 6, 735 [Google Scholar]
- Bennett, C. J., Chen, S., Sun, B., Chang, A. H. H., & Kaiser, R. I. 2007, ApJ, 660, 1588 [NASA ADS] [CrossRef] [Google Scholar]
- Bennett, C. J., Hama, T., Kim, Y. S., Kawasaki, M., & Kaiser, R. I. 2011, ApJ, 727, 27 [NASA ADS] [CrossRef] [Google Scholar]
- Bergantini, A., Gòbi, S., Abplanalp, M. J., & Kaiser, R. I. 2018a, ApJ, 852, 70 [NASA ADS] [CrossRef] [Google Scholar]
- Bergantini, A., Zhu, C., & Kaiser, R. I. 2018b, ApJ, 862, 140 [NASA ADS] [CrossRef] [Google Scholar]
- Bergin, E. A., Melnick, G. J., Stauffer, J. R., et al. 2000, ApJ, 539, L129 [NASA ADS] [CrossRef] [Google Scholar]
- Bergman, P., Parise, B., Liseau, R., et al. 2011, A&A, 531, L8 [NASA ADS] [CrossRef] [EDP Sciences] [Google Scholar]
- Bertin, M., Romanzin, C., Michaut, X., Jeseck, P., & Fillion, J.-H. 2011, J. Phys. Chem. C, 115, 12920 [NASA ADS] [CrossRef] [Google Scholar]
- Bouteiller, Y., & Perchard, J. 2004, Chem. Phys., 305, 1 [Google Scholar]
- Brogan, C. L., Hunter, T. R., Cyganowski, C. J., et al. 2016, ApJ, 832, 187 [Google Scholar]
- Brown, R. D., Crofts, J. G., Godfrey, P. D., et al. 1975, ApJ, 197, L29 [NASA ADS] [CrossRef] [Google Scholar]
- Burke, D. J., Wolff, A. J., Edridge, J. L., & Brown, W. A. 2008, J. Chem. Phys., 128, 104702 [NASA ADS] [CrossRef] [Google Scholar]
- Burke, D. J., Puletti, F., Woods, P. M., et al. 2015, J. Chem. Phys., 143, 164704 [NASA ADS] [CrossRef] [Google Scholar]
- Butscher, T., Duvernay, F., Theule, P., et al. 2015, MNRAS, 453, 1587 [NASA ADS] [CrossRef] [Google Scholar]
- Butscher, T., Duvernay, F., Danger, G., & Chiavassa, T. 2016, A&A, 593, A60 [NASA ADS] [CrossRef] [EDP Sciences] [Google Scholar]
- Carvajal, M., Favre, C., Kleiner, I., et al. 2019, A&A, 627, A65 [NASA ADS] [CrossRef] [EDP Sciences] [Google Scholar]
- Ceccarelli, C., Caselli, P., Fontani, F., et al. 2017, ApJ, 850, 176 [NASA ADS] [CrossRef] [Google Scholar]
- Chaabouni, H., Baouche, S., Diana, S., & Minissale, M. 2020, A&A, 636, A4 [Google Scholar]
- Chen, Y., Van Gelder, M. L., Nazari, P., et al. 2023, A&A, 678, A137 [NASA ADS] [CrossRef] [EDP Sciences] [Google Scholar]
- Chen, Y., Rocha, W. R. M., Van Dishoeck, E. F., et al. 2024, A&A, 690, A205 [NASA ADS] [CrossRef] [EDP Sciences] [Google Scholar]
- Chuang, K.-J., Fedoseev, G., Qasim, D., et al. 2020, A&A, 635, A199 [EDP Sciences] [Google Scholar]
- Coussan, S., Bouteiller, Y., Perchard, J. P., & Zheng, W. Q. 1998, J. Phys. Chem. A, 102, 5789 [Google Scholar]
- Danho, A., Mardyukov, A., & Schreiner, P. R. 2023, Chem. Commun., 59, 11524 [Google Scholar]
- Dartois, E., Schutte, W., Geballe, T. R., et al. 1999, A&A, 342, L32 [NASA ADS] [Google Scholar]
- De Barros, A. L. F., Domaracka, A., Andrade, D. P. P, et al. 2011, MNRAS, 418, 1363 [NASA ADS] [CrossRef] [Google Scholar]
- De Simone, M., Codella, C., Ceccarelli, C., et al. 2020, A&A, 640, A75 [NASA ADS] [CrossRef] [EDP Sciences] [Google Scholar]
- Draine, B. T. 2010, in Physics of the Interstellar and Intergalactic Medium (Princeton: Princeton University Press), 119 [Google Scholar]
- Du, F., Parise, B., & Bergman, P. 2012, A&A, 538, A91 [NASA ADS] [CrossRef] [EDP Sciences] [Google Scholar]
- El-Abd, S. J., Brogan, C. L., Hunter, T. R., et al. 2019, ApJ, 883, 129 [Google Scholar]
- Emtiaz, S. M., Toriello, F., He, J., & Vidali, G. 2022, J. Phys. Chem. A, 126, 1973 [Google Scholar]
- Ewing, G. E., & Pimentel, G. C. 1961, J. Chem. Phys., 35, 925 [Google Scholar]
- Favre, C., Pagani, L., Goldsmith, P. F., et al. 2017, A&A, 604, L2 [NASA ADS] [CrossRef] [EDP Sciences] [Google Scholar]
- Fayolle, E. C., Öberg, K. I., Cuppen, H. M., Visser, R., & Linnartz, H. 2011, A&A, 529, A74 [NASA ADS] [CrossRef] [EDP Sciences] [Google Scholar]
- Ferrière, K. M. 2001, Rev. Mod. Phys., 73, 1031 [NASA ADS] [CrossRef] [Google Scholar]
- Garrod, R. T., Weaver, S. L. W., & Herbst, E. 2008, ApJ, 682, 283 [NASA ADS] [CrossRef] [Google Scholar]
- Garrod, R. T., Jin, M., Matis, K. A., et al. 2022, ApJS, 259, 1 [NASA ADS] [CrossRef] [Google Scholar]
- Gerakines, P. A., Schutte, W. A., & Ehrenfreund, P. 1996, A&A, 312, 289 [NASA ADS] [Google Scholar]
- Gibb, E. L., Whittet, D. C. B., Boogert, A. C. A., & Tielens, A. G. G. M. 2004, ApJS, 151, 35 [NASA ADS] [CrossRef] [Google Scholar]
- Goddi, C., Ginsburg, A., Maud, L. T., Zhang, Q., & Zapata, L. A. 2020, ApJ, 905, 25 [NASA ADS] [CrossRef] [Google Scholar]
- Goldsmith, P. F. 2001, ApJ, 557, 736 [Google Scholar]
- Goldsmith, P. F., Liseau, R., Bell, T. A., et al. 2011, ApJ, 737, 96 [Google Scholar]
- Gould, R. J., & Salpeter, E. E. 1963, ApJ, 138, 393 [NASA ADS] [CrossRef] [Google Scholar]
- Herbst, E., & Van Dishoeck, E. F. 2009, ARA&A, 47, 427 [Google Scholar]
- Hollis, J. M., Lovas, F. J., & Jewell, P. R. 2000, ApJ, 540, L107 [Google Scholar]
- Hudson, R. L. 2017, Spectrochim. Acta Part A: Mol. Biomol. Spectrosc., 187, 82 [Google Scholar]
- Hudson, R. L., & Ferrante, R. F. 2020, MNRAS, 492, 283 [Google Scholar]
- Hudson, R. L., Moore, M. H., & Cook, A. M. 2005, Adv. Sp. Res., 36, 184 [Google Scholar]
- Hudson, et al. 2009, The Cosmic Ice Laboratory - IR Spectra, https://science.gsfc.nasa.gov/691/cosmicice/spectra.html [Google Scholar]
- Ioppolo, S., Cuppen, H. M., Van Dishoeck, E. F., & Linnartz, H. 2011, MNRAS, 410, 1089 [NASA ADS] [CrossRef] [Google Scholar]
- Isokoski, K., Poteet, C. A., & Linnartz, H. 2013, A&A, 555, A85 [NASA ADS] [CrossRef] [EDP Sciences] [Google Scholar]
- Jeong, J.-H., Lee, J.-E., Lee, S., et al. 2025, ApJS, 276, 49 [Google Scholar]
- Kaiser, R. I. 2002, Chem. Rev., 102, 1309 [Google Scholar]
- Khan, W., Ramachandran, R., Gupta, S., et al. 2025, Life Sci. Space Res., in press [Google Scholar]
- Kleimeier, N. F., Eckhardt, A. K., & Kaiser, R. I. 2020, ApJ, 901, 84 [Google Scholar]
- Kleimeier, N. F., Eckhardt, A. K., & Kaiser, R. I. 2021, J. Am. Chem. Soc., 143, 14009 [CrossRef] [Google Scholar]
- Kogure, N., Ono, T., Suzuki, E., & Watari, F. 1993, J. Mol. Struct., 296, 1 [Google Scholar]
- Kou, Z., Li, X., Qin, S.-L., et al. 2025, MNRAS, 538, 2579 [Google Scholar]
- Krim, L., Jonusas, M., Lemaire, J. L., & Vidali, G. 2018, Phys. Chem. Chem. Phys., 20, 19750 [Google Scholar]
- Larsson, B., Liseau, R., Pagani, L., et al. 2007, A&A, 466, 999 [NASA ADS] [CrossRef] [EDP Sciences] [Google Scholar]
- Lattelais, M., Pauzat, F., Ellinger, Y., & Ceccarelli, C. 2009, ApJ, 696, L133 [Google Scholar]
- Lefloch, B., Ceccarelli, C., Codella, C., et al. 2017, MNRAS, 469, L73 [Google Scholar]
- Leroux, K., & Krim, L. 2020, MNRAS, 500, 1188 [Google Scholar]
- Lin, M.-Y., Lo, J.-I., Lu, H.-C., et al. 2014, J. Phys. Chem. A, 118, 3438 [Google Scholar]
- Loison, J.-C., Wakelam, V., & Hickson, K. M. 2014, MNRAS, 443, 398 [Google Scholar]
- Luna, R., Molpeceres, G., Ortigoso, J., et al. 2018, A&A, 617, A116 [NASA ADS] [CrossRef] [EDP Sciences] [Google Scholar]
- Lykke, J. M., Favre, C., Bergin, E. A., & Jørgensen, J. K. 2015, A&A, 582, A64 [NASA ADS] [CrossRef] [EDP Sciences] [Google Scholar]
- Maity, S., Kaiser, R. I., & Jones, B. M. 2014, Faraday Discuss., 168, 485 [NASA ADS] [CrossRef] [Google Scholar]
- Maity, S., Kaiser, R. I., & Jones, B. M. 2015, Phys. Chem. Chem. Phys., 17, 3081 [NASA ADS] [CrossRef] [Google Scholar]
- Manigand, S., Jørgensen, J. K., Calcutt, H., et al. 2020, A&A, 635, A48 [NASA ADS] [CrossRef] [EDP Sciences] [Google Scholar]
- Marcelino, N., Gerin, M., Cernicharo, J., et al. 2018, A&A, 620, A80 [NASA ADS] [CrossRef] [EDP Sciences] [Google Scholar]
- Mehringer, D. M., Snyder, L. E., Miao, Y., & Lovas, F. J. 1997, ApJ, 480, L71 [NASA ADS] [CrossRef] [Google Scholar]
- Mejia, C., De Barros, A. L. F., Rothard, H., Boduch, P., & Da Silveira, E. F. 2020, ApJ, 894, 132 [CrossRef] [Google Scholar]
- Mejia, C., de Barros, A. L. F., Domaracka, A., et al. 2024, A&A, 687, A227 [Google Scholar]
- Mininni, C., Beltrán, M. T., Rivilla, V. M., et al. 2020, A&A, 644, A84 [NASA ADS] [CrossRef] [EDP Sciences] [Google Scholar]
- Modica, P., & Palumbo, M. E. 2010, A&A, 519, A22 [NASA ADS] [CrossRef] [EDP Sciences] [Google Scholar]
- Molpeceres, G., Satorre, M. A., Ortigoso, J., et al. 2017, MNRAS, 466, 1894 [NASA ADS] [CrossRef] [Google Scholar]
- Molpeceres, G., Kästner, J., Herrero, V. J., Peláez, R. J., & Maté, B. 2022, A&A, 664, A169 [NASA ADS] [CrossRef] [EDP Sciences] [Google Scholar]
- Nazari, P., Cheung, J. S. Y., Asensio, J. F., et al. 2024, A&A, 686, A59 [NASA ADS] [CrossRef] [EDP Sciences] [Google Scholar]
- Olivares, C. D. B., Carrascosa, H., Escribano, B., Caro, G. M. M., & Martin-Doménech, R. 2023, MNRAS, 527, 8829 [Google Scholar]
- Olofsson, G., Pagani, L., Tauber, J. A., et al. 1998, A&A, 339, L81 [Google Scholar]
- Padovani, M., Galli, D., & Glassgold, A. E. 2009, A&A, 501, 619 [NASA ADS] [CrossRef] [EDP Sciences] [Google Scholar]
- Pagani, L., Olofsson, A. O. H., Bergman, P., et al. 2003, A&A, 402, L77 [CrossRef] [EDP Sciences] [Google Scholar]
- Pagani, L., Favre, C., Goldsmith, P. F., et al. 2017, A&A, 604, A32 [NASA ADS] [CrossRef] [EDP Sciences] [Google Scholar]
- Palumbo, M. E., Castorina, A. C., & Strazzulla, G. 1999, A&A, 342, 551 [NASA ADS] [Google Scholar]
- Palumbo, M. E., Leto, P., Siringo, C., & Trigilio, C. 2008, ApJ, 685, 1033 [NASA ADS] [CrossRef] [Google Scholar]
- Parise, B., Bergman, P., & Du, F. 2012, A&A, 541, L11 [NASA ADS] [CrossRef] [EDP Sciences] [Google Scholar]
- Pirim, C., & Krim, L. 2011, Phys. Chem. Chem. Phys., 13, 19454 [Google Scholar]
- Qasim, D., Fedoseev, G., Chuang, K.-J., et al. 2019, A&A, 627, A1 [NASA ADS] [CrossRef] [EDP Sciences] [Google Scholar]
- Rautio, R. P. V., Watkins, A. E., Comerón, S., et al. 2022, A&A, 659, A153 [NASA ADS] [CrossRef] [EDP Sciences] [Google Scholar]
- Remijan, A., Snyder, L. E., Liu, S., Mehringer, D., & Kuan, Y. 2002, ApJ, 576, 264 [Google Scholar]
- Remijan, A., Snyder, L. E., Friedel, D. N., Liu, S., & Shah, R. Y. 2003, ApJ, 590, 314 [Google Scholar]
- Rivilla, V. M., Colzi, L., Jiménez-Serra, I., et al. 2022, ApJ, 929, L11 [NASA ADS] [CrossRef] [Google Scholar]
- Rocha, W. R. M., Van Dishoeck, E. F., Ressler, M. E., et al. 2024, A&A, 683, A124 [NASA ADS] [CrossRef] [EDP Sciences] [Google Scholar]
- Rodler, M., Blom, C. E., & Bauder, A. 1984, J. Am. Chem. Soc., 106, 4029 [Google Scholar]
- Rouillé, G., Jäger, C., & Henning, T. 2020, ApJ, 892, 96 [Google Scholar]
- Rubin, M., Altwegg, K., Balsiger, H., et al. 2019, MNRAS, 489, 594 [Google Scholar]
- Ruffle, D. P., & Herbst, E. 2001, MNRAS, 322, 770 [Google Scholar]
- Ryazantsev, S. V., & Feldman, V. I. 2015, J. Phys. Chem. A, 119, 2578 [Google Scholar]
- Ryazantsev, S. V., Duarte, L., Feldman, V. I., & Khriachtchev, L. 2017, Phys. Chem. Chem. Phys., 19, 356 [Google Scholar]
- Saenko, E. V., & Feldman, V. I. 2016, Phys. Chem. Chem. Phys., 18, 32503 [Google Scholar]
- Sandford, S. A., Allamandola, L. J., Tielens, A. G. G. M., & Valero, G. J. 1988, ApJ, 329, 498 [NASA ADS] [CrossRef] [Google Scholar]
- Shalabiea, O. M., Caselli, P., & Herbst, E. 1998, ApJ, 502, 652 [Google Scholar]
- Shope, B. M., El-Abd, S. J., Brogan, C. L., et al. 2024, ApJ, 972, 146 [Google Scholar]
- Skouteris, D., Balucani, N., Ceccarelli, C., et al. 2018, ApJ, 854, 135 [NASA ADS] [CrossRef] [Google Scholar]
- Smith, R. S., Huang, C., Wong, E. K. L., & Kay, B. D. 1997, Phys. Rev. Lett., 79, 909 [NASA ADS] [CrossRef] [Google Scholar]
- Taquet, V., López-Sepulcre, A., Ceccarelli, C., et al. 2015, ApJ, 804, 81 [Google Scholar]
- Taquet, V., Van Dishoeck, E. F., Swayne, M., et al. 2018, A&A, 618, A11 [NASA ADS] [CrossRef] [EDP Sciences] [Google Scholar]
- Tercero, B., Cuadrado, S., López, A., et al. 2018, A&A, 620, L6 [NASA ADS] [CrossRef] [EDP Sciences] [Google Scholar]
- Terwisscha Van Scheltinga, J., Marcandalli, G., McClure, M. K., Hogerheijde, M. R., & Linnartz, H. 2021, A&A, 651, A95 [NASA ADS] [CrossRef] [EDP Sciences] [Google Scholar]
- Van Dishoeck, E. F., Kristensen, L. E., Mottram, J. C., et al. 2021, A&A, 648, A24 [NASA ADS] [CrossRef] [EDP Sciences] [Google Scholar]
- Van Gelder, M. L., Francis, L., Van Dishoeck, E. F., et al. 2024, A&A, 692, A197 [NASA ADS] [CrossRef] [EDP Sciences] [Google Scholar]
- Wang, J., Zhang, C., Marks, J. H., & Kaiser, R. I. 2025, ApJ, 984, 138 [Google Scholar]
- Whittet, D. C. B., Poteet, C. A., Chiar, J. E., et al. 2013, ApJ, 774, 102 [NASA ADS] [CrossRef] [Google Scholar]
- Wright, G. S., Rieke, G. H., Glasse, A., et al. 2023, PASP, 135, 048003 [NASA ADS] [CrossRef] [Google Scholar]
- Wu, Y.-J., Yang, X., & Lee, Y.-P. 2004, J. Chem. Phys., 120, 1168 [NASA ADS] [CrossRef] [Google Scholar]
- Xue, C., Remijan, A. J., Burkhardt, A. M., & Herbst, E. 2019, ApJ, 871, 112 [Google Scholar]
- Zasimov, P. V., Sanochkina, E. V., & Feldman, V. I. 2022, Phys. Chem. Chem. Phys., 24, 419 [Google Scholar]
- Zasimov, P. V., Sanochkina, E. V., Tyurin, D. A., & Feldman, V. I. 2023, Phys. Chem. Chem. Phys., 25, 21883 [Google Scholar]
- Zasimov, P. V., Volosatova, A. D., Gòbi, S., et al. 2024, J. Chem. Phys., 160, 024308 [NASA ADS] [CrossRef] [Google Scholar]
Appendix A Tables
Vibrational assignments of solid CH3CH2OH: Matrix isolation and astrophysical ices
Vibrational assignments of the main photo-products resulting from UV photolysis of CH3CH2OH/Ne
Photo-products from CH3CH2OH+hν reaction : UV irradiation of ethanol ice at 10 K
Photo-product from CH3CH2OH+O2+hν reaction: UV irradiation of ethanol-dioxygen ice at 10 K
All Tables
Photo-products from CH3CH2OH+O2+hν reaction: UV irradiation of ethanol-dioxygen ice at 10 K.
Vibrational assignments of solid CH3CH2OH: Matrix isolation and astrophysical ices
Vibrational assignments of the main photo-products resulting from UV photolysis of CH3CH2OH/Ne
Photo-products from CH3CH2OH+hν reaction : UV irradiation of ethanol ice at 10 K
Photo-product from CH3CH2OH+O2+hν reaction: UV irradiation of ethanol-dioxygen ice at 10 K
All Figures
|
Fig. 1 IR spectra between 4250 and 500 cm−1 of CH3CH2 OH isolated in a neon matrix before (a) and after (b) UV irradiation. δ, ωC-H: bending modes; ρC-H: rocking modes; R-CHO : complex organic molecule with CHO group. |
| In the text | |
|
Fig. 2 IR spectra, between 2280 and 1500 cm−1, of CH3CH2OH isolated in neon matrix before (a) and after (b) UV irradiation. |
| In the text | |
|
Fig. 3 IR spectra, between 2400 and 500 cm 1, of pure CH3CH2OH ice at 10 K before (b) and after (c) UV irradiation. Spectrum (a), taken from NASA cosmic ice laboratory (Hudson et al. 2009), shows the CH3CHO:H2O ice. |
| In the text | |
|
Fig. 4 IR spectra between 3600 and 500 cm 1, showing the evolution of pure CH3CH2OH ice formed at 10 K, during the heating process. |
| In the text | |
|
Fig. 5 IR spectra of pure, irradiated CH3CH2OH ice, between 1900 and 500 cm−1, during the heating process from 10 to 165 K. |
| In the text | |
|
Fig. 6 IR spectra - between 2450 and 500 cm−1 - of CH3CH2OH:O2 ice at 10 K before (d) and after (e) UV irradiation versus CH3CH2OH ice at 10 K before (b) and after (c) UV irradiation. Spectrum (a), which is taken from the NASA cosmic ice laboratory (Hudson et al. 2009), shows the CH3CHO:H2O ice. Asterisks mark the position of the two shoulders, tentatively assigned to GA and AA. |
| In the text | |
|
Fig. 7 IR spectra - between 1900 and 500 cm 1 - of the irradiated CH3CH2OH:O2 ice during the heating process. GA is presumably detected at 1754 cm−1 (Hudson et al. 2005) and AA at 1698 cm−1 (Olivares et al. 2023). |
| In the text | |
|
Fig. 8 IR spectra of irradiated CH3CH2OH:O2 between 1825 and 1600 cm−1 at 10, 120, and 160 K. Spectrum (a): Experimental data. Spectrum (b): Combination of the different modeled signals (dotted lines). Spectrum (c): Difference between data and model; i.e., the residual. |
| In the text | |
|
Fig. 9 TPD spectra of molecular mass m/z = 60 during the thermal processing: (a) pure CH3CH2OH experiment; (b) irradiated CH3CH2OH experiment; and (c) irradiated CH3CH2OH:O2 experiment. |
| In the text | |
Current usage metrics show cumulative count of Article Views (full-text article views including HTML views, PDF and ePub downloads, according to the available data) and Abstracts Views on Vision4Press platform.
Data correspond to usage on the plateform after 2015. The current usage metrics is available 48-96 hours after online publication and is updated daily on week days.
Initial download of the metrics may take a while.