| Issue |
A&A
Volume 706, February 2026
|
|
|---|---|---|
| Article Number | A365 | |
| Number of page(s) | 10 | |
| Section | Cosmology (including clusters of galaxies) | |
| DOI | https://doi.org/10.1051/0004-6361/202557492 | |
| Published online | 20 February 2026 | |
A sub-ppm upper limit on the cosmological variations of the fine structure constant α
1
Department of Space, Earth and Environment, Chalmers University of Technology, Onsala Space Observatory SE-43992 Onsala, Sweden
2
Aix-Marseille Univ, CNRS, CNES, LAM Marseille, France
3
Institut de Radioastronomie Millimétrique 300 rue de la piscine 38406 St Martin d’Hères, France
4
LRA/LUX, Observatoire de Paris, PSL, CNRS & École Normale Supérieure 75231 Paris, France
5
LUX, Observatoire de Paris, PSL, Collège de France, CNRS, Sorbonne University 75014 Paris, France
6
Department of Physics and Astronomy, VU University Amsterdam De Boelelaan 1100 1081 HZ Amsterdam, The Netherlands
7
Max-Planck-Institut für Radioastonomie Auf dem Hügel 69 D-53121 Bonn, Germany
8
Centre for Astrophysics and Supercomputing, Swinburne University of Technology Hawthorn Victoria 3122, Australia
9
Institut d’Astrophysique de Paris, UMR 7095, CNRS, Sorbonne Université 98 bis boulevard Arago F-75014 Paris, France
★ Corresponding author: This email address is being protected from spambots. You need JavaScript enabled to view it.
Received:
30
September
2025
Accepted:
13
December
2025
Abstract
Absorption spectroscopy toward high-redshift quasars provides strong constraints on the putative variation of fundamental constants of physics on cosmological timescales. The submillimeter ground-state transitions of methylidyne (CH) and water (H2O), both molecules widespread and coeval in the interstellar medium, provide a sensitive test for variations in α, the fine structure constant, and μ, the proton-to-electron mass ratio, taking advantage of the unmatched spectral resolution and frequency reliability of radio techniques. We used ALMA simultaneous observations of the two species to constrain any velocity offset between their absorption profiles toward the radio-bright lensed quasars PKS 1830−211 (zabs = 0.89) and B 0218+357 (zabs = 0.68). Our observational setup minimizes instrumental errors and known sources of systematics, such as time variability of the absorption profile and frequency-dependent morphology of the background quasar. The excellent correlation between CH and H2O opacities, the large number of individual narrow velocity components, and the number of independent spectra obtained due to the intrinsic time variability of the absorption profiles ensure that even the chemical segregation bias is minimized. We obtained bulk velocity shifts of δv = −0.048 ± 0.028 km s−1 and −0.13 ± 0.14 km s−1 (1σ confidence level) between CH and H2O in the direction of PKS 1830−211(NE) and B 0218+357(SW), respectively. These values convert into the 3σ upper limits |Δα/α|< 0.55 ppm and 1.5 ppm, respectively, taking into account the independent upper limits on |Δμ/μ| previously obtained for these systems. These constraints on |Δα/α|, at look-back times of about half the present age of the Universe, are two to four times deeper than previous constraints on any other single high-z system.
Key words: quasars: absorption lines / cosmological parameters / radio lines: galaxies / quasars: individual: PKS1830-211 / quasars: individual: B0218+357
In memoriam.
© The Authors 2026
 Open Access article, published by EDP Sciences, under the terms of the Creative Commons Attribution License (https://creativecommons.org/licenses/by/4.0), which permits unrestricted use, distribution, and reproduction in any medium, provided the original work is properly cited.
This article is published in open access under the Subscribe to Open model. This email address is being protected from spambots. You need JavaScript enabled to view it. to support open access publication.
1. Introduction
Whether new physics exists beyond the standard model of particle physics and general relativity remains one of the most compelling questions in modern science. Einstein’s equivalence principle, which states that the result of any nongravitational experiment is independent of when and where it is performed, has been confronted for a century by deep investigations, involving atomic clocks, spontaneous fission in the Oklo natural reactor, and, lately, astronomical observations. So far, only hints of a possible violation of the equivalence principle have been reported, essentially based on measurements of the fundamental fine-structure constant α in remote quasars (e.g., the reviews by Martins 2017; Uzan 2025), although they are now most likely explained by systematic errors (e.g., Rahmani et al. 2013; Whitmore & Murphy 2015).
The equivalence principle was challenged in the 1930s by Dirac (1937), who postulated that dimensionless ratios of universal fundamental constants, such as the proton-to-electron mass ratio μ = mp/me = 1836.152673426(32) and the electromagnetic fine-structure constant α = e2/4πϵ0ℏc = 7.2973525643(11)×10−3 ∼ 1/137 (2022 CODATA recommended values1, Mohr et al. 2025) are not plain numbers but have profound significance and may vary through space-time. The question gained special attention after the discovery, in 1998, that the expansion of the Universe has been accelerating for at least 6 Gyr (Riess et al. 1998). This acceleration, which is expected to have been sparked by an enigmatic dark energy (Frieman et al. 2008), renewed interest in post-Einsteinian gravitational models involving extra dimension(s) to those of space-time. From there, a quintessence or phantom dynamical scalar field would couple with the charged matter and induce time and/or space variations of the electromagnetic interaction between charged particles, and hence variations of α. Accurate measurements of the α value in remote galaxies allow us to test this hypothesis (e.g., Savedoff 1956; Bahcall & Schmidt 1967; Drinkwater et al. 1998). From a theoretical point of view, variations of μ and α have been established to be correlated in models of grand unification, although the correlation coefficient is highly model-dependent (e.g., Calmet & Fritzsch 2006, Uzan 2025, and references therein). Furthermore, it has recently been proposed that varying constants (e.g., me(z), α(z)) could provide a potential path towards alleviating the tension between Hubble constant values inferred from cosmic microwave background (CMB) observations and those derived from SNe Ia and Cepheid data in the context of the standard Λ cold dark matter cosmological model (e.g., Hart & Chluba 2020; Sekiguchi & Takahashi 2021; Lee et al. 2023; Schöneberg & Vacher 2025).
In the last two decades, spectacular progress has been achieved in telescope sensitivity, which has opened access to spectroscopic studies of very distant galaxies and quasars. This made it possible to compare α and μ in sources of different redshifts, z, and in different directions. The value of α can be derived by measuring the frequency of atomic or molecular fine-structure transitions, and the value of μ through that of molecular rotational, inversion, and torsion-rotational transitions, as long as at least two of these transitions have different sensitivity coefficients, Kα, μ, to variations in α and μ, respectively.
So far, most spectroscopic studies of high-redshift objects have relied on observations of optical lines of atomic ions, detected in absorption toward distant quasars. They concern some 300 absorption systems with redshifts ranging from 0.1 to 6, i.e., with look-back times between 1 and 13 billion years, observed with the world’s largest optical telescopes: Keck, VLT, and Subaru (for example, Webb et al. 1999, 2001; Murphy et al. 2003; King et al. 2012; Evans et al. 2014; Murphy & Cooksey 2017). The analyses of those data yield rather discrepant conclusions regarding α (see, e.g., the review by Martins 2017). Possible evidence of variation in α with space-time was reported (Webb et al. 1999; Murphy et al. 2001; Webb et al. 2011; King et al. 2012). The normalized difference between the values of α measured in remote quasars and that measured in a terrestrial laboratory, Δα/α, is on the order of a few parts per million (ppm). Furthermore, a 4-sigma dipole anisotropy with Δα/α = 8 ± 2 ppm was obtained in favor of quasars located near the direction RA ≃ 17.5 h, Dec ≃ −58°. This anisotropy was based on a first analysis of 128 archival absorption systems detected along the lines of sight to 68 quasars with the Keck/HIRES telescope (Murphy et al. 2003), followed by a second analysis of 151 additional systems detected toward 60 quasars within the redshift range 0.5 < z < 3.5 with the VLT/UVES (Webb et al. 2011; Wilczynska et al. 2015). Per contra, tighter limits to any variation of α were subsequently reported from dedicated, more sensitive observations carried out with the Subaru/HDS telescope (Δα/α = 3.0 ± 2.8stat + 2.0syst ppm, Murphy & Cooksey 2017), VLT/UVES (Δα/α = 1.3 ± 2.4stat + 1.0syst ppm, Molaro et al. 2013), VLT/X-SHOOTER (up to z = 7.1, Wilczynska et al. 2020), and VLT/ESPRESSO (Δα/α = 1.3 ± 1.3stat + 0.4syst ppm, Murphy et al. 2022).
In any case, and as was pointed out by these and other works (see, e.g., Murphy et al. 2003, 2022; Webb et al. 2011; Whitmore & Murphy 2015; Wilczynska et al. 2015), observations at optical wavelengths are hampered by the low sensitivity of UV atomic transitions to α variations and by the limited spectral resolving power of most optical spectrometers. Systematic errors further compound these challenges: i) echelle spectrometers are subject to physical distortions that are difficult to calibrate; this particularly affects the stacking of archival spectra, observed on different sources with different telescopes, which are averaged together to decrease the instrumental noise (Evans et al. 2014); ii) jitters of the quasar point-like images across the spectrometer slit, due to unstable atmosphere or inaccurate compensation of the sky rotation, induce wavelength measurement errors. Progress has recently been achieved through the installation of the new echelle spectrograph ESPRESSO on the VLT, specially designed for high resolution (resolving power R = 145 000) and high spectral fidelity, in particular with the use of optical fibers, which removes environmental disturbances. So far, observations from only one remote quasar (HE0515−4414, zabs = 1.15) with this spectrograph have been reported, yielding Δα/α = 1.3 ± 1.4stat + 0.4syst ppm or |Δα/α|< 5.7 ppm as a 3σ upper limit (Murphy et al. 2022). The same quasar holds the best constraint on any individual high-z system, obtained by combining three independent measurements from three different spectrographs: Δα/α = −0.62 ± 0.50stat + 0.48syst or |Δα/α|< 2.7 ppm (3σ) (Murphy et al. 2022).
It remains that the spectra of quasars at optical wavelengths are particularly rich in atomic lines from several species, and that the absorption profiles of those lines can be very broad. This leads to the blending of lines from different species with different Kα sensitivities. The resulting spectra are then difficult to analyze, even with advanced methods such as many multiplet fitting (Webb et al. 1999). In addition, the different isotopes of atoms have close albeit not identical transition wavelengths, so that their lines partly overlap. Their relative abundances in high-z absorbers are not known, and hence are usually set to their terrestrial value. This introduces unpredictable errors on the transition wavelength measurements, and therefore on Δα/α (see, e.g., Webb et al. 2025).
An alternative for measurements of α in remote galaxies consists of observing atomic or mainly molecular fine-structure lines at submillimeter wavelengths. This is now possible thanks to the high sensitivity and high angular and spectral resolution of current interferometers, such as ALMA and NOEMA. Submillimeter wave observations have multiple advantages. On the technical side, the atmospheric dispersion effects are less critical at those wavelengths. The incoming sky signal, picked up by a horn, then channeled through waveguides to a digital spectrometer that is frequency-locked to an atomic clock, is more dependable and can be analyzed with a much higher frequency resolution than in any optical spectrometer (e.g., as high as R ∼ 108 versus ≃104 − 5 for UVES and for ESPRESSO, the latest such instrument). On the target side, the submillimeter domain gives us access to molecular fine-structure and rotation lines. Molecular absorbers typically have narrower absorption profiles than the optical ones and show much less jammed spectra. In particular, the millimeter/submillimeter transitions of the different isotopologs of a given molecular species are well separated in frequency and their lines do not overlap.
In the present study, we focus on the two outstanding molecular absorbers at intermediate redshifts of zabs = 0.88582 and zabs = 0.68466, which intercept the lines of sight to the radio-bright quasars PKS 1830−211 and B 0218+357, respectively. Both absorbers have already been subject to extended spectral studies at millimeter and submillimeter wavelengths and are known to be rich in molecular species (see, e.g., Wiklind & Combes 1995, 1996, 1998; Muller et al. 2006, 2011, 2014a; Wallström et al. 2016). In particular, the same constraint has been claimed for these two absorbers: |Δμ/μ|< 3.6 × 10⁻⁷ (at a 3σ confidence level), using methanol lines toward PKS 1830−211 on the one hand (Muller et al. 2021, see also Bagdonaite et al. 2013a,b; Kanekar et al. 2015) and using inversion lines of ammonia with respect to rotational lines of other species toward B 0218+357 on the other hand (Murphy et al. 2008; Kanekar 2011)2. Interestingly, each quasar also lies near (≲40°) one of the two poles of the α dipole anisotropy tentatively detected at 4σ by Webb et al. (2011) in their analysis of the Keck and VLT data, making a good test of the dipole in the intermediate redshift range.
2. Methylidyne and variations of α and μ
Methylidyne, CH, the very first molecule detected in the interstellar medium (Swings & Rosenfeld 1937)3, is known to be, with water, among the best proxies of molecular hydrogen (Gérin et al. 2016). An open-shell radical, it has been extensively studied in the spectroscopic laboratory (see, e.g., Brown & Evenson 1983; Truppe et al. 2014).
For CH, as for all diatomic molecules with an odd number of electrons, the interaction of molecular rotation with electronic motions leads to a partial uncoupling of the electron spin, S, and the orbital angular momentum, L, from the internuclear axis. Spin-uncoupling splits the CH 2Π ground state into two substates, 2Π1/2 and 2Π3/2, separated in energy by A, the spin-coupling constant. These substates correspond to the allowed orientations of the spin with respect to the angular momentum. L-uncoupling from the axis further splits the otherwise doubly degenerated rotational levels of each substate into two closely spaced sublevels denoted as + and − according to their parity (Λ-doubling). Finally, the magnetic moment of the hydrogen nucleus further splits each of those sublevels into two hyperfine components labeled F = 1, 0 for J = 1/2 and F = 1, 2 for J = 3/2 (see, e.g., Truppe et al. 2014 and Fig. 1).
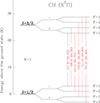 |
Fig. 1. Diagram of the lowest rotational energy levels of CH. The Λ-doublet and hyperfine levels are not to scale. The rest-frame frequencies of CH transitions observed by ALMA are indicated in red, in gigahertz, and their relative line strengths are given in parenthesis. |
The rotational constant, B, of light-weight molecules is large. By chance, for CH, its value (B = 425.5 GHz) is close to half the value of A (A = 834.8 GHz), the separation between the spin substates. This has two beneficial consequences for us. Firstly, the 2Π1/2 and 2Π3/2 rotational level manifolds overlap in energy so that mixed transitions from one manifold to the other are allowed. In particular, transitions between the lowest rotational level of the 2Π1/2 substate (N = 1, J = 1/2) and that of the 2Π3/2 substate (N = 1, J = 3/2) are not only allowed, but have relatively large transition strengths (see Fig. 1 and Table 1). Secondly, their rest frequencies (∼532.7 and 536.8 GHz) are close to that of the 110 − 101 ground rotational line of ortho-H2O (∼556.9 GHz). All these three line sets can be observed almost continuously from z ∼ 0.1 to ∼7 within ALMA bands 2–8, and even simultaneously in favorable cases, at z = 0.68 and 0.89 for example.
Spectroscopic parameters of the CH and H2O transitions considered here and their sensitivity coefficients to variations of μ and α.
Pure rotational and mixed transitions have quite different sensitivities to variations of α and μ. The former are sensitive to μ, while the latter are essentially sensitive to α, so that their combination provides a good test of the variations of these two constants. The sensitivity coefficients, Kα and Kμ, of the CH mixed transitions mentioned above were calculated by de Nijs et al. (2012) (see Table 1). They found Kα = 1.59, 1.57 and Kμ = −0.20, −0.22 for the + → − (∼533 GHz) and − → + (∼537 GHz) transitions, respectively. The sensitivity differences between those CH lines and a pure rotational line, such as the 110 − 101 ground-state transition of ortho-H2O, with Kα = 0 and Kμ = −1, are then ΔKα = 1.6 and ΔKμ = 0.8. Any variations, Δα and Δμ, would therefore introduce a velocity shift, δv, between the spectra of CH and H2O:
 (1)
(1)
In particular, the sensitivity, ΔKα, is more than one order of magnitude higher than that governing the UV lines of metal ions (see, e.g., Fig. 3 by Murphy et al. 2022), which until now constitute the bulk of previous high-redshift constraints on Δα/α. Equation (1) shows that the variations of α and μ cannot be disentangled. However, since very low upper limits to the variation of μ (|Δμ/μ|≤ few 10−7) have already been independently derived for our molecular absorbers (see the end of Sect. 1), the observation of CH and H2O lines provides an exceptionally sensitive test of the variations of α.
We note that the J = 1/2+ − 1/2− (3.3 GHz, rest) and J = 3/2+ − 3/2− (0.7 GHz, rest) Λ-doublets have been previously used (in conjunction with OH 1.6 GHz lines) to constrain local variations of μ and α in sources of the Milky Way by Truppe et al. (2013)4. However, those radio lines typically have optical depths several orders of magnitude lower than those of the submillimeter ones at 533–537 GHz in the interstellar medium.
3. Observations
3.1. PKS 1830−211
The spectra of CH and H2O were observed simultaneously with ALMA at several epochs between 2012 and 2016. One visit was made on 2012 April 11 during ALMA Cycle 0 Early Science, two visits were made in 2014 (May 05 and July 17), and monitoring consisting of multiple visits spread over six months and with an irregular cadence between 6–21 days was performed in 2016. Those data have previously been presented by Muller et al. (2014a, 023). We refer to these publications for the complete descriptions of the data reduction and summarize here only the information relevant to this work.
The number of 12 m antennas in the array was 16 for 2012 Cycle 0 observations, between 31 and 33 in 2014, and between 36 and 45 during the 2016 monitoring. The on-source integration time per visit was 50 min in 2012, ∼30 min in 2014, and 7.5 min/visit during the 2016 campaign. The resulting synthesized beam was ≲0.5″ for all observations, allowing us to resolve well the two lensed images of the quasar, separated by ∼1″ (e.g., Subrahmanyan et al. 1990; Frye et al. 1997; Muller et al. 2020). The amount of precipitable water vapor was typically between 0.6 and 2 mm. The correlator was set up with separate spectral windows to cover the CH and H2O lines, redshifted in the frequency range of ALMA Band 7 receivers (Mahieu et al. 2012), with a velocity resolution of 1.0 km s−1 (2012 data) and 0.6 km s−1 (2014-2016 data). Data reduction was performed in CASA5 with a standard calibration procedure. The visibilities of PKS 1830−211 were self-calibrated and the spectra were extracted from visibility fitting using the Python tool UVMultiFit (Martí-Vidal et al. 2014), taking a model consisting of two point sources with free amplitudes and relative positions fixed at the known locations of the two lensed images of the quasar (hereafter NE and SW images). The final spectra (Fig. 2, left, and middle columns) were normalized to the continuum level of each image.
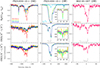 |
Fig. 2. Spectra of CH and H2O lines toward PKS 1830−211 NE and SW images (left, middle, respectively), and toward B 0218+357(SW) (right) observed by ALMA at different epochs. The spectra are colored by dates, as is indicated in the top left and top right boxes. The hyperfine structure of each CH Λ-doublet is indicated at the bottom of spectra. The spectrum of the H218O isotopolog, taken on 2014 May 05, is also shown for PKS 1830−211(SW) (top-middle box, in light blue). A zoom on the weak v ∼ +170 km s−1 velocity component is shown for PKS 1830−211(SW), with the 2016 averaged spectra (in purple) instead of that taken on 2016 March 05. |
On 2014 May 05, a separate tuning including the ground-state transition of the H218O isotopolog was observed for ∼36 min on-source, providing a clear detection toward PKS 1830−211(SW) (Fig. 2, top-middle box). These data shared the same setup and same calibration procedure as described in the previous paragraph.
3.2. B 0218+357
Both CH and H2O were observed simultaneously with ALMA on 2016 October 11 with the Band 7 receivers. The synthesized beam was ∼0.1″, smaller than the separation of 0.33″ between the two lensed images of the quasar (O’Dea et al. 1992; Patnaik et al. 1993). The correlator was set up with spectral windows of 0.938 GHz width and a velocity resolution of 0.5 km s−1. The calibration of the data and the extraction of the spectra with UVMultiFit followed the same procedure as was described for PKS 1830−211. The spectra toward B 0218+357 (Fig. 2, right column) are noticeably noisier than those toward PKS 1830−211, due to its lower flux density, its lower elevation from the ALMA site (∼30° maximum elevation, whereas PKS 1830−211 transits near zenith), and the limited integration time (∼15 min on-source, with 44 antennas in the array and a low amount of precipitable water vapor of ∼0.5 mm during the observations).
4. Analysis and results
4.1. Description of spectra
Both absorption systems, PKS 1830−211 and B 0218+357, share very similar properties, with the background quasar lensed by the foreground absorber in two main bright and compact images. In the case of PKS 1830−211, both lines of sight present molecular absorption (Wiklind & Combes 1998; Muller et al. 2006, 2014a). For PKS 1830−211(NE), the absorption profile is composed of a series of narrow (a few kilometers per second wide) and optically thin (τ ≲ 0.1 for H2O) features between v ∼ −250 and −100 km s−1 (Fig. 2, left column), well adapted for the comparison of CH and H2O profiles. For PKS 1830−211(SW) (Fig. 2, middle column), there is a main absorption feature at v = 0 km s−1, with a width of 10–20 km s−1 for optically thin lines (e.g., CH, H218O). However, this central component becomes saturated and flat bottomed over a range of ∼20 km s−1 for the very optically thick line of H2O. This region is therefore not useful for our purpose of comparing the kinematics of CH and H2O directly. On the other hand, the broad wings (covering up to ∼150 km s−1) seen on the H2O absorption quickly disappear below the noise level for CH. Therefore, it is difficult to make a tight comparison of the CH and H2O profile for the main feature of PKS 1830−211(SW), unless the optically thin H218O isotopolog is used in complement (as was done for the 2014 May 05 data). While several other weak velocity components were identified (Muller et al. 2011, 2014a), we highlight the presence of the narrow (a few kilometers per second wide) and isolated feature near v = +170 km s−1, which can then be used to constrain the kinematics of CH versus H2O, although with a limited signal-to-noise ratio. Interestingly, the quasar activity, with intrinsic changes in its morphology effectively amplified by the lens geometry, introduces a time variability of the absorption profile with a timescale of a few days to months (Muller & Guélin 2008; Schulz et al. 2015; Muller et al. 2023), which, in practice, is equivalent to multiplying the effective number of lines of sight from different absorber systems.
In the case of B 0218+357, only the line of sight to the southwestern lensed image shows molecular absorption (Menten & Reid 1996; Muller et al. 2007). The absorption profile resembles that of PKS 1830−211(SW), with a select number of velocity components within ≲30 km s−1 (Fig. 2, right column). The H2O absorption does not reach saturation, while the peak opacity of CH appears to be intermediate between those of PKS 1830−211 NE and SW profiles.
4.2. Fitting of a common multi-Gaussian profile
We assume that the spectra of both CH and H2O can be described by a common opacity profile, Gτ(v), composed of the sum of individual Gaussian components. The normalized absorption spectra are then:
 (2)
(2)
where fc is the continuum covering factor (0 ≤ fc ≤ 1). During the fit, the profile, Gτ(v), was normalized to a fiducial CH hyperfine component of intensity 1 (hereafter, CH*), and convolved to the hyperfine structure of CH, with the relative intensities of hyperfine components following their statistical weights (see Table 1 and discussion in Sect. 5.2.1). For H2O, the opacity profile, Gτ(v), was scaled by a factor of  . Lastly, we introduced a relative bulk velocity offset, δv (that is, given to each individual velocity component of the opacity profile, Gτ), between the two species. Therefore, the fitting procedure included the following parameters: centroid velocity, linewidth, and peak opacity for each Gaussian component, plus the covering factor, if not fixed, the global scaling ratio, γτ, and the bulk velocity offset, δv.
For the fit, we used the Python scipy.curve_fit least-squares routine. The uncertainties were derived as the square root of the diagonal elements of the covariance matrix multiplied by the reduced χ2. The number of Gaussian velocity components was adjusted by successive trials, until the residuals became free from features above the noise level and the reduced χ2 close to unity. We ended up fixing the number of Gaussians to 17 for the line of sight toward PKS 1830−211(NE), 11 for PKS 1830−211(SW), 3 for the v = +170 km s−1 isolated velocity component toward PKS 1830−211(SW), and 5 for B 0218+357(SW). The same fitting setups were used for our tests with synthetic spectra (see Sect. 4.6).
The best-fit results for δv and γτ are given in Table 2 together with the χ2 values for the three lines of sight. All reduced χ2 are close to unity, suggesting that the CH and H2O spectra are reasonably well represented by our assumption of a common opacity profile. To illustrate this, we have overlaid the latter on top of the opacity profiles of CH and H2O for several absorption features in Fig. 3. For CH, we have deconvolved each CH Λ-doublet from its hyperfine structure following the iterative CLEAN algorithm (Högbom 1974), with the relative intensities of the hyperfine components fixed to their statistical equilibrium values. The two profiles were normalized to an equivalent single hyperfine component of intensity 1 and averaged together. The opacity profile of H2O was scaled by the corresponding ratio, γτ. The fit profiles are clearly driven by the higher signal-to-noise ratio of the H2O line but are remarkably consistent with the CH profile, within uncertainties.
Bulk velocity offsets (δv) and opacity scaling ratios (γτ) between CH and H2O spectra toward PKS 1830−211 and B 0218+357 from fitting a common opacity profile to both species (including H218O when specified).
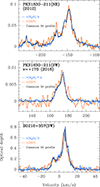 |
Fig. 3. Overlay of the opacity profiles of CH (average of the two Λ-doublets, deconvolved from their respective hyperfine structure) and H2O (scaled by the opacity ratio γτ), on top of their common fit profile (see Sect. 4.2) for PKS 1830−211(NE) (top, 2012 data), the isolated velocity component near v ∼ +170 km s−1 toward PKS 1830−211(SW) (middle, average of the 2016 data), and B 0218+357(SW) (bottom). Note the span of two orders of magnitude between the optical depths of these features. |
4.3. Results for the PKS 1830−211(NE) sightline
Since all velocity offset measurements have been made from different datasets, taken at different epochs and with clear time variations of the absorption profile (Muller et al. 2023), we consider them to be statistically independent. Taking their weighted average for all individual epochs, we obtain a value of δv = −0.048 ± 0.028 km s−1. For the opacity scaling ratio between H2O and CH, we obtain an average of γτ = 4.00 ± 0.02, which is consistent with the value that we would expect taking the relative abundances of CH and H2O observed along the Milky Way’s diffuse sightlines (Sheffer et al. 2008; Flagey et al. 2013, see also the discussion by Muller et al. 2023 on the correlation of CH and H2O opacities, where they estimate γτ ranging between ∼3 and ∼9). A fixed covering factor, fc = 1, was assumed for this line of sight, since the lines have low apparent optical depths and the profile does not appear to be saturated. In fact, Muller et al. (2017) found a covering factor of fc > 0.8 for this line of sight. Changing the value of fc to 0.8 in our fits yielded similar velocity offsets and scaling ratios within uncertainties. As long as the lines are optically thin, we expect a degeneracy between fc and the opacities of the individual velocity components, absorbed in the fit.
Our method of fitting a common profile may introduce some systematics if the absorption profiles of CH and H2O are not strictly identical, i.e., if the scaling ratios, γτ, change between individual velocity components. However, we argue that both the number of independent velocity components in the profile and the number of epochs (here the time variability of the absorption profile between different epochs helps us to improve the statistics) tend to minimize any systematic effect between CH and H2O. This is confirmed by testing the effect of varying the opacity ratio, γτ, for each velocity component on synthetic spectra (see Sect. 4.6 below).
4.4. Results for PKS 1830−211(SW)
For the epoch when H218O was observed within the same day as CH and H2O, we obtain a bulk velocity offset, δv = 0.041 ± 0.070 km s−1, between CH and the water isotopologs, consistent with no kinematics difference. Regarding its uncertainty, this measurement is at the level of the best value of a single visit obtained toward PKS 1830−211(NE), which suggests that the very high signal-to-noise ratio of the SW spectra just compensates for the larger number and narrowness of the velocity components in the NE line of sight. The opacity ratio between H2O and CH is γτ = 8.33 ± 0.08, and we find an isotopolog abundance ratio of H216O/H218O = 67 ± 2, consistent with previous measurements (Muller et al. 2023). The covering factor is well determined by the saturated part of the water line and was kept as a free parameter of the fit, resulting in fc = 0.944 ± 0.002.
In addition, we obtain three more measurements using the isolated v = 170 km s−1 component alone, although with somewhat large uncertainties. All spectra obtained during the 2016 monitoring were averaged together before fit, in order to improve the signal-to-noise ratio. Combining these three measurements, we obtain a value of δv = −0.11 ± 0.13 km s−1. The opacity ratio, γτ, is similar between this component and the main feature near v = 0 km s−1, and a factor two higher than that obtained for PKS 1830−211(NE), which may reflect a different physico-chemical environment between the two lines of sight, as has previously been suggested by Muller et al. (2023). Combining the results from the v = 0 and v = 170 km s−1 features, we obtain δv = 0.005 ± 0.061 km s−1.
4.5. Results for B 0218+357(SW)
The single-epoch measurement of the velocity offset between CH and H2O, δv = −0.13 ± 0.14 km s−1, is consistent with zero and its uncertainty is comparable to that of individual measurements toward PKS 1830−211(NE). Because the signal-to-noise ratio of the spectra is limited, and with the lack of additional constraints on the covering factor, fc, we have explored the effect of varying fc between 0.8 and 1.0, by fixing its value during the fit. There was no significant impact on δv within uncertainties. On the other hand, the opacity scaling ratio depends on fc, with values of γτ increasing from 3.01 ± 0.10, for fc = 1.0, to 3.57 ± 0.15, for fc = 0.8. This is explained because the absorption has a higher optical depth than in the case of PKS 1830−211(NE). The values of the scaling ratios are again consistent with the range of values observed in diffuse sightlines in the Milky Way. They are closer to those obtained in the NE line of sight of PKS 1830−211 than those in its SW line of sight, adding to previous evidence collected by Wallström et al. (2016, 2019) that the absorbing material in B 0218+357(SW) has properties close to PKS 1830−211(NE).
4.6. Test on synthetic spectra
In order to test the robustness of our fitting procedure, we ran Monte Carlo simulations on synthetic spectra. The initial opacity profile was composed of 13 Gaussian components for PKS 1830−211(NE), and 5 components for PKS 1830−211(SW), with properties similar to those of the real spectra observed in 2016. A fixed bulk velocity offset, δv = 1 km s−1, and scaling ratios, γτ = 4.0 and 8.0, were set between the two species, for the NE and SW sightlines, respectively. The covering factor, fc, was set to 1.0 and 0.95 for the NE and SW spectra, respectively. For each Monte Carlo run, we added a Gaussian channel noise of root mean square σ = 0.5%, similar to the noise of our observed spectra (Muller et al. 2023). We further let the amplitude of each Gaussian velocity component of the H2O profile vary by the factor 1 + f(λ), where f(λ) is a random number taken from a Gaussian probability distribution of dispersion, λ. This allowed us to test the effect of a possible varying opacity ratio between CH and H2O. The fitting procedure was then strictly identical to the treatment of real observational data, as is described in Sect. 4.2. This entire process was iterated several hundred times to extract the statistical values shown in Table 3.
Fit results of Monte Carlo simulations of CH and H2O synthetic spectra with random amplitude variations governed by the dispersion, λ.
These simulations suggest that the bulk velocity offset can be recovered with typical uncertainties similar to the real observations (Table 2) even in the case of variation of up to 20–30% for PKS 1830−211(NE). In contrast, the fit quality of PKS 1830−211(SW) spectra depends much more critically on the amount of amplitude variations (i.e., the spread in the correlation between CH and H2O). For them, the fit uncertainties of δv jump to values higher than 0.3 km s−1, as soon as 10% variations are introduced. This is due to both the smaller number of velocity components (5 versus 13 for PKS 1830−211(NE)) and to the saturation of H2O, where the fitting loses constraints on the bulk velocity offset for H2O saturated velocity components. The covering factor, fc, set as a free parameter for the fit of PKS 1830−211(SW) spectra, was always recovered with uncertainties lower than a few per mil.
In either case, we note that the uncertainties of the scaling ratio, γτ, grow faster than those of the velocity offset when the amplitude variations per individual velocity components increase. The relatively small dispersion of the average γτ from our real PKS 1830−211(NE) spectra in Table 2 is then a good indication that the method of fitting a common opacity profile is robust, at least for this line of sight.
5. Discussion
5.1. New constraints on Δα/α
We can convert the final weighted average measurement, δv = −0.048 ± 0.028 km s−1, between CH and H2O toward PKS 1830−211(NE) into constraints on the variations of μ and α using Eq. (1). All the upper limits below are built as |x|+3σx. If we assume that there are no variations of μ, we obtain |Δα/α|< 0.28 ppm. If we now assume that there are no variations of α, we get |Δμ/μ|< 0.55 ppm. This last constraint is similar to that obtained by Muller et al. (2021), |Δμ/μ|< 0.54 ppm, using methanol lines along the line of sight to PKS 1830−211(SW). Combining this independent constraint on Δμ/μ from methanol and our new constraint from CH–H2O lines, we derive |Δα/α|< 0.55 ppm, which is the tightest cosmological constraint on Δα/α so far, a factor four deeper than for any other single high-z system (see, e.g., Murphy et al. 2022 and a compilation by Uzan 2025). Toward B 0218+357(SW), we take our measurement δv = −0.13 ± 0.14 km s−1 and the independent constraint |Δμ/μ|< 7.1 ppm from Kanekar (2011) and obtain the final constraint |Δα/α|< 1.5 ppm.
Our measurements provide a radio alternative to optical studies to test the apparent α dipole anisotropy described in the introduction. The direction to PKS 1830−211 is Θ ∼ 39° away from the pole in the southern hemisphere (RA ≃17.5 h; Dec ≃ − 58°), and the direction to B 0218+357 is Θ ∼ 38° away from the opposite pole. With a dipole of Δα/α described as 𝒟cos(Θ), we find that the difference in variation, Δα/α, between the directions to PKS 1830−211 and B 0218+357 would then be ∼1.6 × 𝒟 (i.e., ∼13 ppm). Taking the bulk velocity offsets between CH and H2O toward PKS 1830−211(NE) and B 0218+357(SW) and the corresponding independent upper limits of Δμ/μ, as was mentioned above, we derive an upper limit of 1.6 ppm (at 3σ) for the difference in Δα/α between our two absorbers. Our measurements, although at different redshifts and based on only two sources, would then rule out an amplitude of 𝒟 ≳ 1 ppm (3σ) for the dipole, in contradiction with the past value measured from atomic absorbers (e.g., Webb et al. 2011). Thereby, our radio measurements add up to the subsequent optical studies examining various systematics to rule out the α dipole anisotropy model.
5.2. Robustness of our constraints
The stringency and robustness of our constraints on Δα/α are ensured by the combination of several factors, including the spectroscopic properties of CH and H2O lines, the properties of the absorber systems PKS 1830−211 and B 0218+357, and our observational setup. We discuss these factors in the following subsections.
5.2.1. Spectroscopy
As has already been highlighted, the CH J = 3/2 − 1/2 and H2O 110–101 transitions are particularly sensitive to variations of α and μ, with a difference in the sensitivity coefficients ΔKα = 1.6 and ΔKμ = 0.8 between them. All lines are close in frequency and can be observed simultaneously with ALMA at z = 0.89 and 0.68 within the same tuning (although with the current system, H218O must be observed with a different tuning).
The rest frequencies of the submillimeter transitions of CH and H2O have been determined with high precision (Table 1 and, e.g., Truppe et al. 2014 for CH, and Cazzoli et al. 2009; Altman et al. 2025, for H2O), with uncertainties lower than 1 kHz, i.e., < 1 m s−1 when converted to velocity. This is two to three orders of magnitude lower than the widths of the velocity components and than the fit uncertainties of the velocity offsets, δv, and therefore negligible in our final error budget.
Moreover, and unlike for atomic lines, the molecular isotopologs (e.g., 13CH, H218O, H217O, see Muller et al. 2023 for their detection) are well separated in frequency. This removes the problem of possible variance of the elemental isotopic ratios from their terrestrial values, encountered in the fitting of optical absorbers when isotopes are blended (e.g., Webb et al. 2025).
Lastly, we have considered above that the relative strengths of the components of the CH hyperfine structure follow their statistical weights, given in Table 1. To test this assumption, we fit the spectra again with the same procedure as was explained in Sect. 4.2, but without the bulk velocity offset between CH and H2O and with the relative strengths of the hyperfine components of CH set as free parameters. Given the limits of the signal-to-noise ratio of the spectra and the number of velocity components, this fitting exercise could only be performed against PKS 1830−211(SW) in order to avoid large degeneracies between the placement and amplitude of the velocity components and relative strengths of the hyperfine components. Again, we used the spectra observed on 2014 May 05 together with H218O to guide the fit around the saturated part of the H2O absorption. We fixed the strength of the strongest hyperfine component of the 533 GHz transitions to 0.83, and found the following results for the others, with the expected statistical weights given in parentheses: 0.37 ± 0.02 (vs. 0.33) and 0.15 ± 0.04 (vs. 0.17) for the 533 GHz transitions, and 0.86 ± 0.04 (vs. 0.83), 0.37 ± 0.02 (vs. 0.33), and 0.15 ± 0.01 (vs. 0.17) for the 537 GHz transitions, in order of decreasing strengths, respectively6. Within the uncertainties, these results are consistent with the values of the statistical weights, and therefore the initial assumption is validated, at least for this dataset. In turn, this is also a good indication that the fit velocity structure is not very different from the true one, and whatever deviations exist, it is not causing large discrepancies in the derived statistical weights.
More generally, we explored with RADEX (van der Tak et al. 2007) the excitation of submillimeter lines of CH under standard interstellar conditions, using hyperfine-resolved collision data from Dagdigian (2018). In contrast to the radio wavelength transitions at ∼3 GHz that are known for their anomalous excitation (see, e.g., Jacob et al. 2024 and references therein), we find that the excitation temperatures of the submillimeter transitions remain well coupled to the temperature of the CMB (e.g., within a few tenths of kelvin from TCMB for a kinetic temperature of 50 K and an H2 volume density up to 104 cm−3).
5.2.2. Properties of the absorbers
The physical and chemical conditions of the absorbing gas in the PKS 1830−211(SW) line of sight have been investigated in detail (e.g., Henkel et al. 2009; Muller et al. 2011, 2013, 2014a, 2016, 2017; Schulz et al. 2015) and found to be comparable to those of translucent clouds in the Milky Way. For the PKS 1830−211(NE) line of sight, the conditions are not as well known, mainly because the molecular absorption there is weaker – column densities are typically one order of magnitude lower than those along PKS 1830−211(SW). However, the properties of the NE absorption are clearly reminiscent of a diffuse component, as is evidenced by 1) the prominence of the H I absorption spectrum in the NE line of sight (Koopmans & de Bruyn 2005; Combes et al. 2021), 2) the enhancement of molecular tracers of low H2-fraction gas, such as ArH+ (Müller et al. 2015), OH+ and H2O+ (Muller et al. 2016), H2Cl+ (Muller et al. 2014b), and CH+ (Muller et al. 2017), and 3) the conditions traced by hydrogen radio recombination lines (Emig et al. 2023). The conditions in the absorber toward B 0218+357(SW) are believed to be intermediate between those in the NE and SW lines of sight toward PKS 1830−211, dominated by a diffuse medium (Henkel et al. 2005; Wallström et al. 2016, 2019).
For a given telescope, the sensitivity of absorption spectroscopy depends on the brightness of the background continuum illumination and the opacity of the foreground material. Both the absorption systems PKS 1830−211 and B 0218+357 present very favorable properties. The quasars are bright at submillimeter wavelengths (∼0.1 − 1 Jy) and the absorbers have relatively high column densities of absorbing gas (N(H2) ∼1021 − 22 cm−2). In fact, the column density of water in PKS 1830−211(SW) is so large that the 557-GHz line becomes highly saturated, forcing us to use the H218O isotopolog to sample the saturated region. On the other hand, the PKS 1830−211(NE) and B 0218+357(SW) sightlines are not saturated, but they still present relatively strong lines. In particular, the PKS 1830−211(NE) sightline is very favorable for three reasons. First, its absorption profile is made up of multiple (≳10), narrow (a few kilometers per second wide), and relatively well-separated velocity components, which is highly favorable for velocity offset measurements. For B 0218+357(SW), the absorption profile is more compact, spread over a smaller velocity range, and composed of only a select number of velocity components, partially overlapping. The number of velocity components in these lines of sight is thus sufficiently large to put on strong constraints, but still not too large to severely affect the fitting procedure with fit ambiguities and convergence issues (see, e.g., Murphy et al. 2022). Secondly, the width of the absorption components is also very favorable for obtaining a high precision (< km s−1) when comparing line kinematics. Third, the time variability of the absorption profile toward PKS 1830−211(NE) allows us to multiply the number of independent measurements with multi-epoch observations. This improves statistics and reduces potential systematic effects when fitting CH and H2O with the same profile.
5.2.3. Observational setup
The heterodyne technique provides a high-frequency resolution (δν/ν ∼ 10−6 in our case) and the instrumental radio frequency bandpass is calibrated with high precision. Since the respective absorption features along the NE and SW lines of sight to PKS 1830−211 do not overlap in velocity, we can also compare both spectra and check that there is no contamination by atmospheric lines or any bandpass artifacts.
The CH and H2O lines are observed simultaneously within the same frequency tuning, with the same atmospheric conditions, the same correlator setup, and the same velocity resolution. Data calibration was performed in parallel with the same procedure. Any instrumental effects are therefore minimized.
Most importantly, the observation of the CH and H2O lines, simultaneous and close in frequency within the same tuning, removes the two most severe sources of known systematics toward PKS 1830−211 (which may also apply to some extent to B 0218+357): the time variability of the absorption profile, which hampers the comparison of spectra taken at different epochs (Muller & Guélin 2008; Schulz et al. 2015; Muller et al. 2023), and the frequency-dependent morphology of the background quasar, which can affect the comparison of absorption lines taken at different frequencies (e.g., Martí-Vidal et al. 2013; Kanekar et al. 2015).
5.2.4. Co-spatiality of CH and H2O
Herschel observations of the same submillimeter lines of CH and H2O in absorption in diffuse sightlines of the Milky Way find that both species are closely correlated and arise from the same gas component (Qin et al. 2010; Gérin et al. 2010; Flagey et al. 2013). The lines connect to the ground-state energy level and have similar subthermal excitation for both species, mostly coupled with photons from the CMB (TCMB = 4.60 K at z = 0.68 and TCMB = 5.14 K at z = 0.89, respectively) at relatively low H2 volume density of a few 103 cm−3 or less.
The excellent correlation between CH and H2O opacities was highlighted by Muller et al. (2023) in both PKS 1830−211 SW and NE sightlines. Although we cannot formally prove that line kinematics do not suffer from chemical differentiation within individual velocity components and that the two species are co-spatial, the overall excellent correlation between CH and H2O, holding in both absorbers and even in spite of time variations of the absorption profile resulting from morphological changes in the background quasar, constitutes strong evidence that both species are tracing the same gas component.
6. Conclusions
We have used ALMA observations of CH and H2O submillimeter lines in the molecular absorbers toward the quasars PKS 1830−211 (zabs = 0.89) and B 0218+357 (zabs = 0.68), respectively, to test the invariance of the fine structure constant, α, and the proton-to-electron mass ratio, μ, at look-back times of nearly half the present age of the Universe with respect to their values, here and today on Earth. Our observational setup minimizes known specific systematics of radio absorbers, such as the time variations of the absorption line profile and the frequency-dependent morphology of the background quasars, as well as instrumental and calibration errors. Based on the average bulk velocity offsets between the CH and H2O absorption profiles and the independent upper limits on Δμ/μ previously obtained in these systems, we derive |Δα/α|< 0.55 ppm and 1.5 ppm in the direction of PKS 1830−211 and B 0218+357, respectively, at a 3σ confidence level. To the best of our knowledge, these are the most stringent constraints on cosmological variations of α, so far. This work highlights the strength of distant radio molecular absorbers for testing the invariance of fundamental constants and, at the same time, the uniqueness of PKS 1830−211 and B 0218+357, as we are not aware of any other sources capable of providing such deep constraints using a similar setup.
Acknowledgments
We thank the referee for her/his contructive comments. This paper makes use of data from the following ALMA projects: ADS/JAO.ALMA#2011.0.00405.S (data from April 2012), ADS/JAO.ALMA#2012.1.00056.S (data from May 2014), ADS/JAO.ALMA#2013.1.00020.S (data from July 2014), ADS/JAO.ALMA#2015.1.00075.S (2016 data) for PKS 1830−211, and ADS/JAO.ALMA#2016.1.00031.S for B 0218$357. ALMA is a partnership of ESO (representing its member states), NSF (USA) and NINS (Japan), together with NRC (Canada) and NSC and ASIAA (Taiwan), in cooperation with the Republic of Chile. The Joint ALMA Observatory is operated by ESO, AUI/NRAO and NAOJ. This research has made intensive use of the NASA’s Astrophysics Data System.
References
- Altman, A., Tóbiás, R., Bogomolov, A. S., et al. 2025, ApJS, 280, 47 [Google Scholar]
- Bagdonaite, J., Jansen, P., Henkel, C., et al. 2013a, Science, 339, 46 [NASA ADS] [CrossRef] [Google Scholar]
- Bagdonaite, J., Daprà, M., Jansen, P., et al. 2013b, Phys. Rev. Lett., 111, 231101 [Google Scholar]
- Bahcall, J. N., & Schmidt, M. 1967, Phys. Rev. Lett., 19, 1294 [Google Scholar]
- Brown, J. M., & Evenson, K. M. 1983, ApJ, 268, 51 [Google Scholar]
- Calmet, X., & Fritzsch, H. 2006, Europhys. Lett., 76, 1064 [Google Scholar]
- Cazzoli, G., Puzzarini, C., Harding, M. E., & Gauss, J. 2009, Chem. Phys. Lett., 473, 21 [NASA ADS] [CrossRef] [Google Scholar]
- Combes, F., Gupta, N., Muller, S., et al. 2021, A&A, 648, A116 [NASA ADS] [CrossRef] [EDP Sciences] [Google Scholar]
- Dagdigian, P. J. 2018, MNRAS, 475, 5480 [Google Scholar]
- de Nijs, A. J., Ubachs, W., & Bethlem, H. L. 2012, Phys. Rev. A, 86, 2501 [CrossRef] [Google Scholar]
- Dirac, P. A. M. 1937, Nature, 139, 323 [Google Scholar]
- Drinkwater, M. J., Webb, J. K., Barrow, J. D., & Flambaum, V. V. 1998, MNRAS, 295, 457 [Google Scholar]
- Emig, K. L., Gupta, N., Salas, P., et al. 2023, ApJ, 994, 93 [Google Scholar]
- Evans, T. M., Murphy, M. T., Whitmore, J. B., et al. 2014, MNRAS, 445, 128 [Google Scholar]
- Flagey, N., Goldsmith, P. F., Lis, D. C., et al. 2013, ApJ, 762, 11 [NASA ADS] [CrossRef] [Google Scholar]
- Frieman, J. A., Turner, M. S., & Huterer, D. 2008, ARA&A, 46, 385 [Google Scholar]
- Frye, B., Welch, W. J., & Broadhurst, T. 1997, ApJ, 478, 25 [Google Scholar]
- Gérin, M., de Luca, M., Goicoechea, J. R., et al. 2010, A&A, 521, A16 [Google Scholar]
- Gérin, M., Neufeld, D., & Goicoechea, J. 2016, ARA&A, 54, 181 [NASA ADS] [CrossRef] [Google Scholar]
- Golubiatnikov, G. Y., Markov, V. N., Guarnieri, A., & Knöchel, R. 2006, J. Mol. Spectrosc., 240, 251 [Google Scholar]
- Hart, L., & Chluba, J. 2020, MNRAS, 493, 3255 [Google Scholar]
- Henkel, C., Jethava, N., Kraus, A., et al. 2005, A&A, 440, 893 [NASA ADS] [CrossRef] [EDP Sciences] [Google Scholar]
- Henkel, C., Menten, K. M., Murphy, M. T., et al. 2009, A&A, 500, 725 [NASA ADS] [CrossRef] [EDP Sciences] [Google Scholar]
- Högbom, J. A. 1974, A&AS, 15, 417 [Google Scholar]
- Jacob, A. M., Nandakumar, M., Roy, N., et al. 2024, A&A, 692, A164 [NASA ADS] [CrossRef] [EDP Sciences] [Google Scholar]
- Kanekar, N. 2011, ApJ, 728, 12 [NASA ADS] [CrossRef] [Google Scholar]
- Kanekar, N., Ubachs, W., Menten, K. M., et al. 2015, MNRAS, 448, 104 [Google Scholar]
- King, J. A., Webb, J. K., Murphy, M. T., et al. 2012, MNRAS, 422, 3370 [Google Scholar]
- Koopmans, L. V. E., & de Bruyn, A. G. 2005, MNRAS, 360, L6 [Google Scholar]
- Lee, N., Ali-Haïmoud, Y., Schöneberg, N., & Poulin, V. 2023, Phys. Rev. Lett., 130, 161003 [Google Scholar]
- Mahieu, S., Maier, D., Lazareff, B., et al. 2012, IEEE Trans. Terahertz Sci. Technol., 2, 29 [Google Scholar]
- Martins, C. J. A. P. 2017, Rep. Progr. Phys., 80, 126902 [Google Scholar]
- Martí-Vidal, I., Muller, S., Combes, F., et al. 2013, A&A, 558, A123 [NASA ADS] [CrossRef] [EDP Sciences] [Google Scholar]
- Martí-Vidal, I., Vlemmings, W., Muller, S., & Casey, S. 2014, A&A, 563, A136 [NASA ADS] [CrossRef] [EDP Sciences] [Google Scholar]
- Menten, K. M., & Reid, M. J. 1996, ApJ, 465, 99 [Google Scholar]
- Mohr, P. J., Newell, D. B., Taylor, B. N., & Tiesinga, E. 2025, Rev. Mod. Phys., 97, 025002 [Google Scholar]
- Molaro, P., Centurión, M., Whitmore, J. B., et al. 2013, A&A, 555, A68 [NASA ADS] [CrossRef] [EDP Sciences] [Google Scholar]
- Muller, S., & Guélin, M. 2008, A&A, 491, 739 [NASA ADS] [CrossRef] [EDP Sciences] [Google Scholar]
- Muller, S., Guélin, M., Dumke, M., et al. 2006, A&A, 458, 417 [NASA ADS] [CrossRef] [EDP Sciences] [Google Scholar]
- Muller, S., Guélin, M., Combes, F., & Wiklind, T. 2007, A&A, 468, 53 [Google Scholar]
- Muller, S., Beelen, A., Guélin, M., et al. 2011, A&A, 535, A103 [NASA ADS] [CrossRef] [EDP Sciences] [Google Scholar]
- Muller, S., Beelen, A., Black, J. H., et al. 2013, A&A, 551, A109 [NASA ADS] [CrossRef] [EDP Sciences] [Google Scholar]
- Muller, S., Combes, F., Guélin, M., et al. 2014a, A&A, 566, A112 [NASA ADS] [CrossRef] [EDP Sciences] [Google Scholar]
- Muller, S., Black, J. H., Guélin, M., et al. 2014b, A&A, 566, L6 [NASA ADS] [CrossRef] [EDP Sciences] [Google Scholar]
- Müller, H. S. P., Muller, S., Schilke, P., et al. 2015, A&A, 582, L4 [NASA ADS] [CrossRef] [EDP Sciences] [Google Scholar]
- Muller, S., Müller, H. S. P., Black, J. H., et al. 2016, A&A, 595, A128 [NASA ADS] [CrossRef] [EDP Sciences] [Google Scholar]
- Muller, S., Müller, H. S. P., Black, J. H., et al. 2017, A&A, 606, A109 [NASA ADS] [CrossRef] [EDP Sciences] [Google Scholar]
- Muller, S., Jaswanth, S., Horellou, C., & Martı-Vidal, I. 2020, A&A, 641, L2 [NASA ADS] [CrossRef] [EDP Sciences] [Google Scholar]
- Muller, S., Ubachs, W., Menten, K. M., Henkel, C., & Kanekar, N. 2021, A&A, 652, A5 [NASA ADS] [CrossRef] [EDP Sciences] [Google Scholar]
- Muller, S., Martí-Vidal, I., Combes, F., et al. 2023, A&A, 674, A101 [NASA ADS] [CrossRef] [EDP Sciences] [Google Scholar]
- Murphy, M. T., & Cooksey, K. L. 2017, MNRAS, 471, 4930 [Google Scholar]
- Murphy, M. T., Webb, J. K., Flambaum, V. V., et al. 2001, MNRAS, 327, 1208 [NASA ADS] [CrossRef] [Google Scholar]
- Murphy, M. T., Webb, J. K., & Flambaum, V. V. 2003, MNRAS, 345, 609 [Google Scholar]
- Murphy, M. T., Flambaum, V. V., Muller, S., & Henkel, C. 2008, Science, 320, 1611 [Google Scholar]
- Murphy, M. T., Molaro, P., & Leite, A. C. O. 2022, A&A, 658, A123 [NASA ADS] [CrossRef] [EDP Sciences] [Google Scholar]
- O’Dea, C. P., Baum, S. A., Stanghellini, C., et al. 1992, AJ, 104, 1320 [CrossRef] [Google Scholar]
- Patnaik, A. R., Browne, I. W. A., King, L. J., et al. 1993, MNRAS, 261, 435 [Google Scholar]
- Qin, S.-L., Schilke, P., Comito, C., et al. 2010, A&A, 521, A14 [Google Scholar]
- Rahmani, H., Wendt, M., Srianand, R., et al. 2013, MNRAS, 435, 861 [Google Scholar]
- Riess, A. G., Filippenko, A. V., Challis, P., et al. 1998, AJ, 116, 1009 [Google Scholar]
- Rydbeck, O. E. H., Elldér, J., & Irvine, W. M. 1973, Nature, 246, 466 [Google Scholar]
- Savedoff, M. P. 1956, Nature, 178, 688 [Google Scholar]
- Schöneberg, N., & Vacher, L. 2025, JCAP, 03, 004 [Google Scholar]
- Schulz, A., Henkel, C., Menten, K. M., et al. 2015, A&A, 574, A108 [NASA ADS] [CrossRef] [EDP Sciences] [Google Scholar]
- Sekiguchi, T., & Takahashi, T. 2021, Phys. Rev. D, 103, 083507 [Google Scholar]
- Sheffer, Y., Rogers, M., Federman, S. R., et al. 2008, ApJ, 687, 1075 [Google Scholar]
- Subrahmanyan, R., Narasimha, D., Pramesh Rao, A., & Swarup, G. 1990, MNRAS, 246, 263 [NASA ADS] [Google Scholar]
- Swings, P., & Rosenfeld, L. 1937, ApJ, 86, 483 [Google Scholar]
- Truppe, S., Hendricks, R. J., Tokunaga, S. K., et al. 2013, Nat. Commun., 4, 2600 [NASA ADS] [CrossRef] [Google Scholar]
- Truppe, S., Hendricks, R. J., Hinds, E. A., & Tarbutt, M. R. 2014, ApJ, 780, 71 [Google Scholar]
- Turner, B. E., & Zuckerman, B. 1974, ApJ, 187, 59 [Google Scholar]
- Uzan, J.-P. 2025, Liv. Rev. Relat., 28, 6 [Google Scholar]
- van der Tak, F. F. S., Black, J. H., Schöier, F. L., Jansen, D. J., & van Dishoeck, E. F. 2007, A&A, 468, 627 [NASA ADS] [CrossRef] [EDP Sciences] [Google Scholar]
- Wallström, S. H. J., Muller, S., & Guélin, M. 2016, A&A, 595, A96 [NASA ADS] [CrossRef] [EDP Sciences] [Google Scholar]
- Wallström, S. H. J., Muller, S., Roueff, E., et al. 2019, A&A, 629, A128 [NASA ADS] [CrossRef] [EDP Sciences] [Google Scholar]
- Webb, J. K., Flambaum, V. V., Churchill, C. W., et al. 1999, Phys. Rev. Lett., 82, 884 [Google Scholar]
- Webb, J. K., Murphy, M. T., Flambaum, V. V., et al. 2001, Phys. Rev. Lett., 87, 091301 [Google Scholar]
- Webb, J. K., King, J. A., Murphy, M. T., et al. 2011, Phys. Rev. Lett., 107, 1101 [CrossRef] [Google Scholar]
- Webb, J. K., Lee, C.-C., Milaković, D., et al. 2025, MNRAS, 539, 1 [Google Scholar]
- Whitmore, J. B., & Murphy, M. T. 2015, MNRAS, 447, 446 [Google Scholar]
- Wiklind, T., & Combes, F. 1995, A&A, 299, 382 [NASA ADS] [Google Scholar]
- Wiklind, T., & Combes, F. 1996, Nature, 379, 139 [Google Scholar]
- Wiklind, T., & Combes, F. 1998, ApJ, 500, 129 [Google Scholar]
- Wilczynska, M. R., Webb, J. K., & King, J. A. 2015, MNRAS, 454, 3082 [NASA ADS] [CrossRef] [Google Scholar]
- Wilczynska, M. R., Webb, J. K., Bainbridge, M., et al. 2020, Sci. Adv., 6, 9672 [Google Scholar]
We note, however, that these upper limits were simply built as three times the final uncertainty of the measurement x ± σx. Instead, taking the upper limits as |x|+3σx, we obtain |Δμ/μ|< 0.54 ppm toward PKS 1830−211 and |Δμ/μ|< 0.71 ppm toward B 0218+357, respectively.
While the 1937 detection of CH was done with the blue lines (A2Δ-X2Π), the first radio detections of CH were done by Rydbeck et al. (1973) and Turner & Zuckerman (1974).
They find Δα/α = (0.3 ± 1.1)×10−7 and Δμ/μ = ( − 0.7 ± 2.2)×10−7, assuming that there is either a change in α or μ, but not in both.
The fit also provided fc = 0.946 ± 0.002, and γτ = 8.6 ± 0.4, with χ2 = 1.4.
All Tables
Spectroscopic parameters of the CH and H2O transitions considered here and their sensitivity coefficients to variations of μ and α.
Bulk velocity offsets (δv) and opacity scaling ratios (γτ) between CH and H2O spectra toward PKS 1830−211 and B 0218+357 from fitting a common opacity profile to both species (including H218O when specified).
Fit results of Monte Carlo simulations of CH and H2O synthetic spectra with random amplitude variations governed by the dispersion, λ.
All Figures
|
Fig. 1. Diagram of the lowest rotational energy levels of CH. The Λ-doublet and hyperfine levels are not to scale. The rest-frame frequencies of CH transitions observed by ALMA are indicated in red, in gigahertz, and their relative line strengths are given in parenthesis. |
| In the text | |
|
Fig. 2. Spectra of CH and H2O lines toward PKS 1830−211 NE and SW images (left, middle, respectively), and toward B 0218+357(SW) (right) observed by ALMA at different epochs. The spectra are colored by dates, as is indicated in the top left and top right boxes. The hyperfine structure of each CH Λ-doublet is indicated at the bottom of spectra. The spectrum of the H218O isotopolog, taken on 2014 May 05, is also shown for PKS 1830−211(SW) (top-middle box, in light blue). A zoom on the weak v ∼ +170 km s−1 velocity component is shown for PKS 1830−211(SW), with the 2016 averaged spectra (in purple) instead of that taken on 2016 March 05. |
| In the text | |
|
Fig. 3. Overlay of the opacity profiles of CH (average of the two Λ-doublets, deconvolved from their respective hyperfine structure) and H2O (scaled by the opacity ratio γτ), on top of their common fit profile (see Sect. 4.2) for PKS 1830−211(NE) (top, 2012 data), the isolated velocity component near v ∼ +170 km s−1 toward PKS 1830−211(SW) (middle, average of the 2016 data), and B 0218+357(SW) (bottom). Note the span of two orders of magnitude between the optical depths of these features. |
| In the text | |
Current usage metrics show cumulative count of Article Views (full-text article views including HTML views, PDF and ePub downloads, according to the available data) and Abstracts Views on Vision4Press platform.
Data correspond to usage on the plateform after 2015. The current usage metrics is available 48-96 hours after online publication and is updated daily on week days.
Initial download of the metrics may take a while.