Open Access
Fig. 11
Download original image
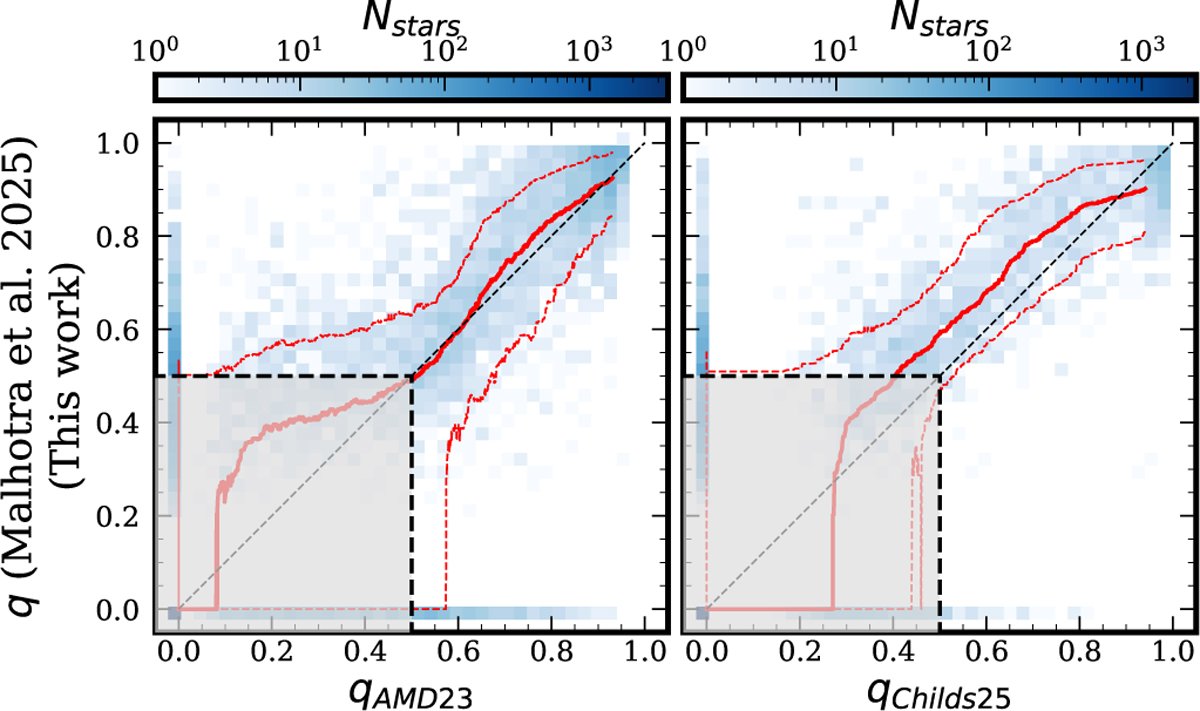
Comparison of the predicted mass ratios with estimates by AMD23 (left) and Childs25 (right). The shaded region indicates the low-q region, and the solid and dashed red lines denote the running median and the 16th to 84th percentiles, respectively.
Current usage metrics show cumulative count of Article Views (full-text article views including HTML views, PDF and ePub downloads, according to the available data) and Abstracts Views on Vision4Press platform.
Data correspond to usage on the plateform after 2015. The current usage metrics is available 48-96 hours after online publication and is updated daily on week days.
Initial download of the metrics may take a while.