Fig. 13
Download original image
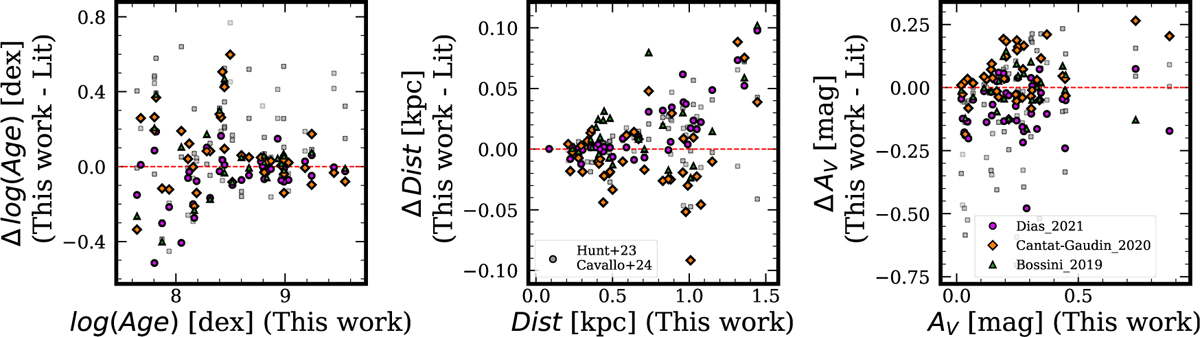
Comparison of the cluster parameters with the literature. The coloured data points denote the estimates from Bossini et al. 2019; Cantat-Gaudin et al. 2020; Dias et al. 2021, and the grey circles indicate the parameters inferred by Hunt & Reffert 2023 and Cavallo et al. 2024. The dashed red line indicates the line of ideal agreement.
Current usage metrics show cumulative count of Article Views (full-text article views including HTML views, PDF and ePub downloads, according to the available data) and Abstracts Views on Vision4Press platform.
Data correspond to usage on the plateform after 2015. The current usage metrics is available 48-96 hours after online publication and is updated daily on week days.
Initial download of the metrics may take a while.