Fig. D.2
Download original image
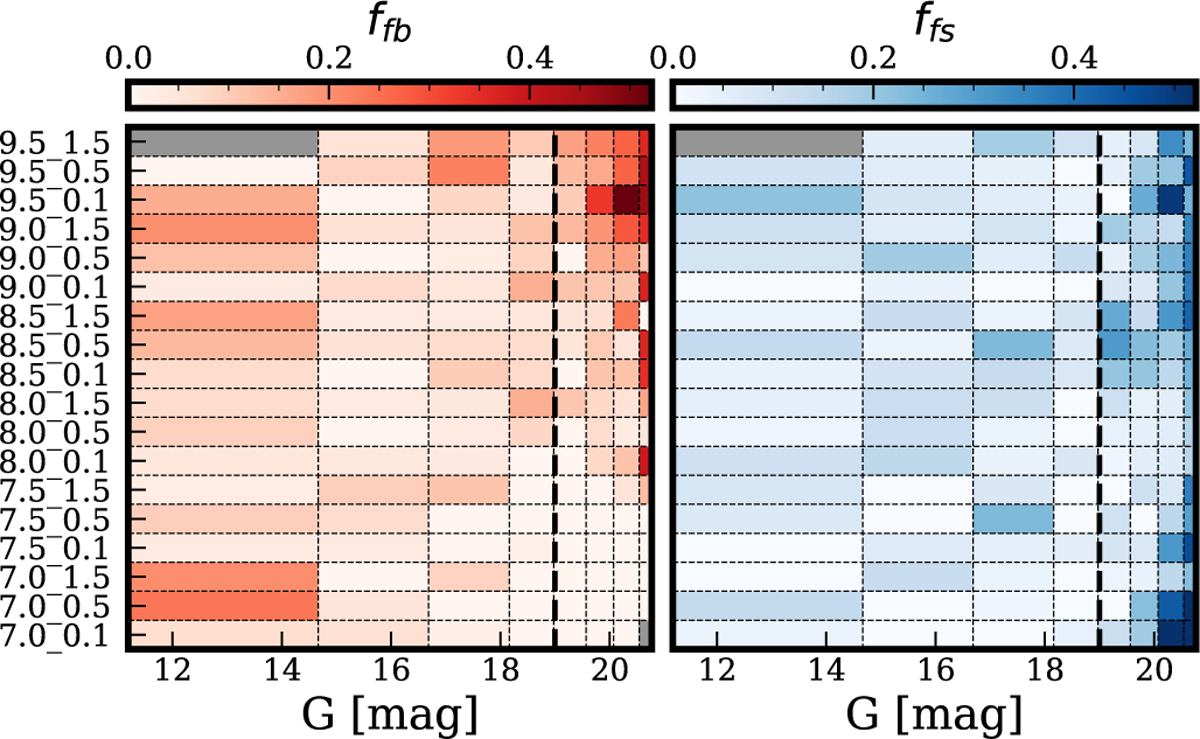
Left : Fraction of falsely predicted binaries defined in Eq. D.1 in each G mag bin for 24 simulated solar metallicity clusters placed at 1 kpc. The clusters are labelled as "log(Age)_AV". Right : Similar to left but for fraction of falsely predicted singles. Gray coloured bins indicate zero predicted or true binaries. The bold vertical dashed line indicates G = 19 mag.
Current usage metrics show cumulative count of Article Views (full-text article views including HTML views, PDF and ePub downloads, according to the available data) and Abstracts Views on Vision4Press platform.
Data correspond to usage on the plateform after 2015. The current usage metrics is available 48-96 hours after online publication and is updated daily on week days.
Initial download of the metrics may take a while.