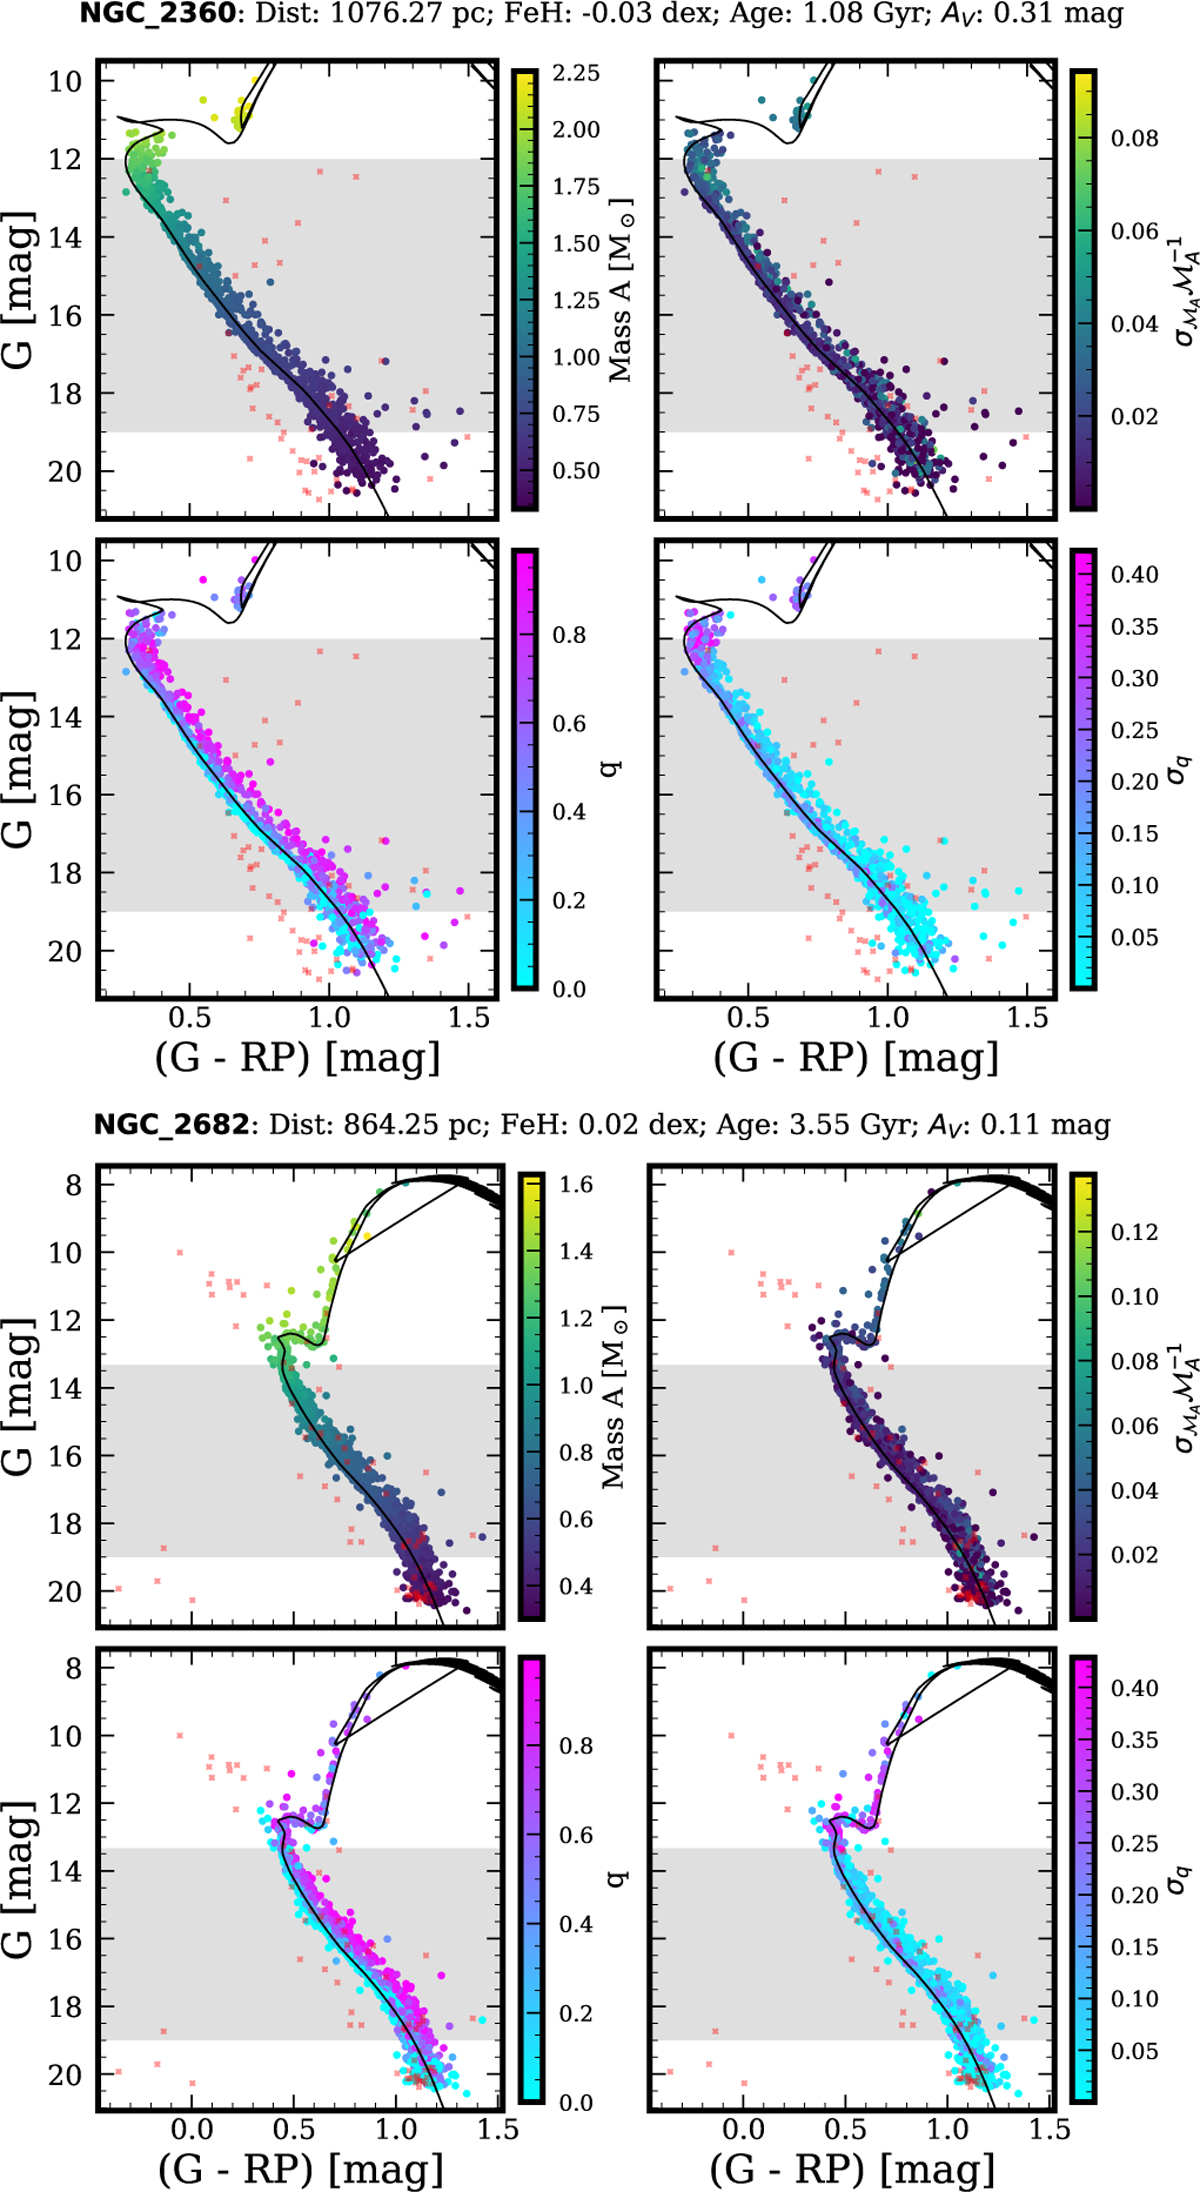
Fig. 5
Download original image
Colour-magnitude diagrams of NGC 2360 (top) and NGC 2682 (M67; bottom). For each cluster, the CMDs are coloured by the primary masses and mass ratios (left) and the corresponding uncertainties (right). The identified photometric outliers are shown by red crosses, and the grey shaded region encloses the MS stars with G ≤ 19 mag. The inferred cluster parameters, along with the spectroscopic metallicity, are listed at the top of each panel.
Current usage metrics show cumulative count of Article Views (full-text article views including HTML views, PDF and ePub downloads, according to the available data) and Abstracts Views on Vision4Press platform.
Data correspond to usage on the plateform after 2015. The current usage metrics is available 48-96 hours after online publication and is updated daily on week days.
Initial download of the metrics may take a while.