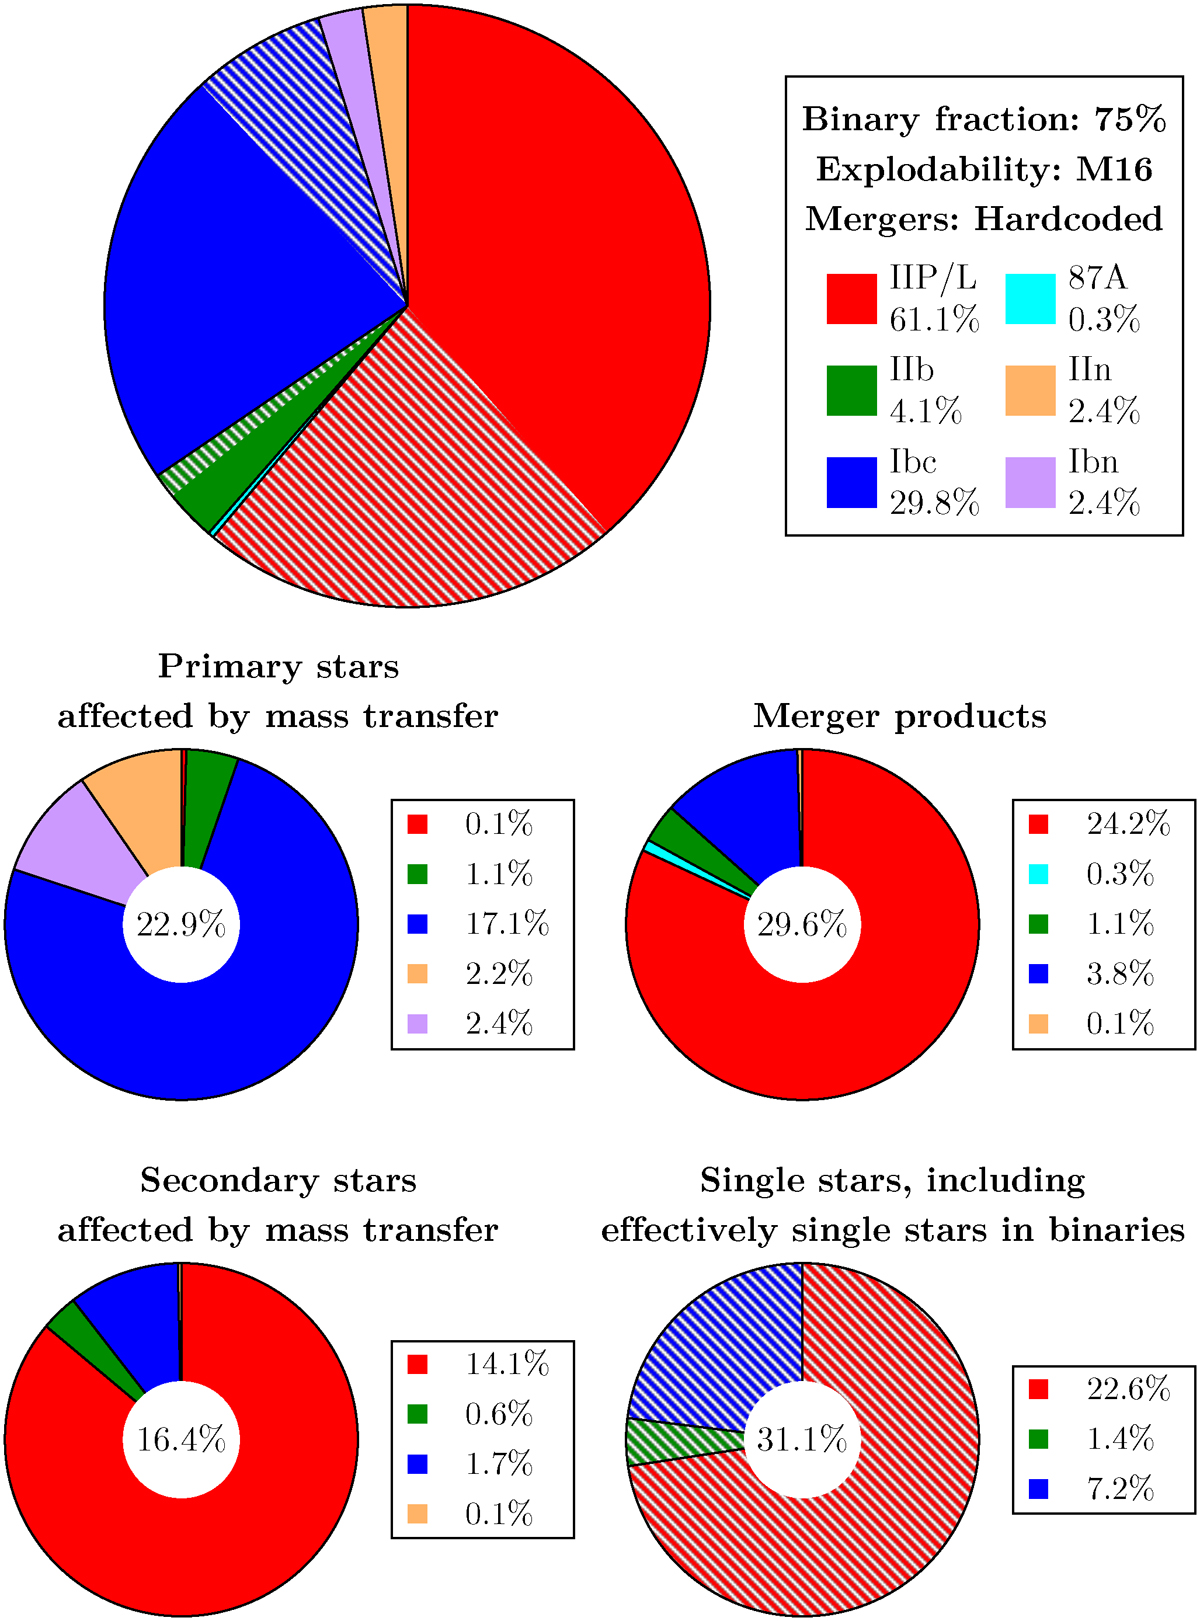
Fig. 1.
Download original image
Pie charts of the distribution of supernova types (different colors) from the models assuming the explodability criterion of M16 and the hard-coded merger criteria. The contribution from stars that do not undergo mass transfer is marked with a white hatching. The four lower panels represent the contribution from each progenitor type (primary and secondary stars that were affected by mass transfer, merger products, and single and effectively single stars). The contribution of each channel is given in the center of the respective pie. The legends show the contribution to each supernova type to the whole distribution. We show a comparable plot based on the explodability criteria of PS20 in Fig. 6.
Current usage metrics show cumulative count of Article Views (full-text article views including HTML views, PDF and ePub downloads, according to the available data) and Abstracts Views on Vision4Press platform.
Data correspond to usage on the plateform after 2015. The current usage metrics is available 48-96 hours after online publication and is updated daily on week days.
Initial download of the metrics may take a while.