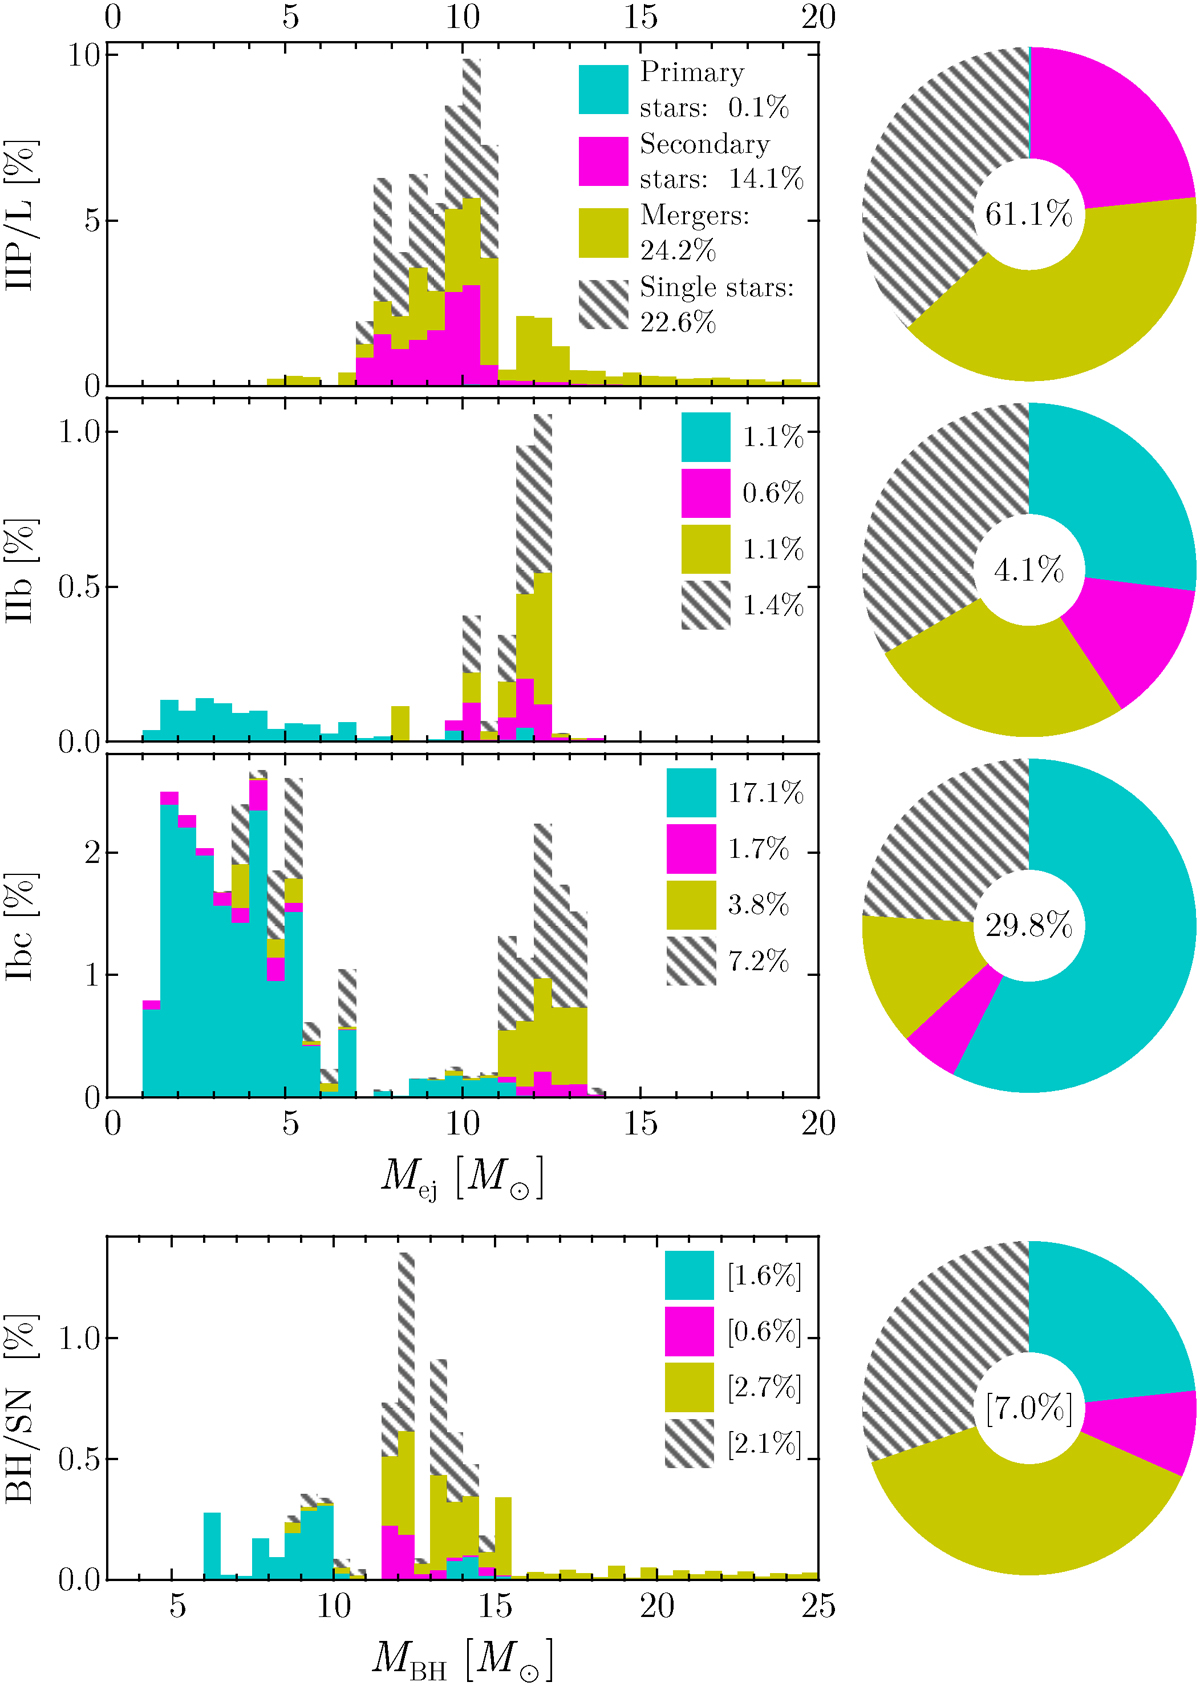
Fig. 2.
Download original image
Stacked histograms of the ejecta mass Mej in our fiducial population model grouped by the supernova type (Type IIP/L, IIb, and Type Ibc supernovae) and normalized by the total number of supernovae (in percent). The contribution is split between primary stars (teal), secondary stars (magenta), merger products (dark gold) or single and effectively single stars (gray). The contribution from stars that have not undergone mass transfer is hatched. The pie charts show the relative contribution of different progenitors to each supernova type. The legend also shows the fraction of supernovae within the whole distribution, and their sum is reported inside the pie charts. Separately, we show a histogram for the mass of BHs, with a pie chart showing the relative contribution of different progenitors, and the number is normalized to that of supernovae. Less than one percentile of the distribution of Type IIP/L supernovae and BHs falls outside of the shown ranges, extending up to 43 M⊙. We show a comparable plot based on the explodability criteria of PS20 in Fig. 7.
Current usage metrics show cumulative count of Article Views (full-text article views including HTML views, PDF and ePub downloads, according to the available data) and Abstracts Views on Vision4Press platform.
Data correspond to usage on the plateform after 2015. The current usage metrics is available 48-96 hours after online publication and is updated daily on week days.
Initial download of the metrics may take a while.