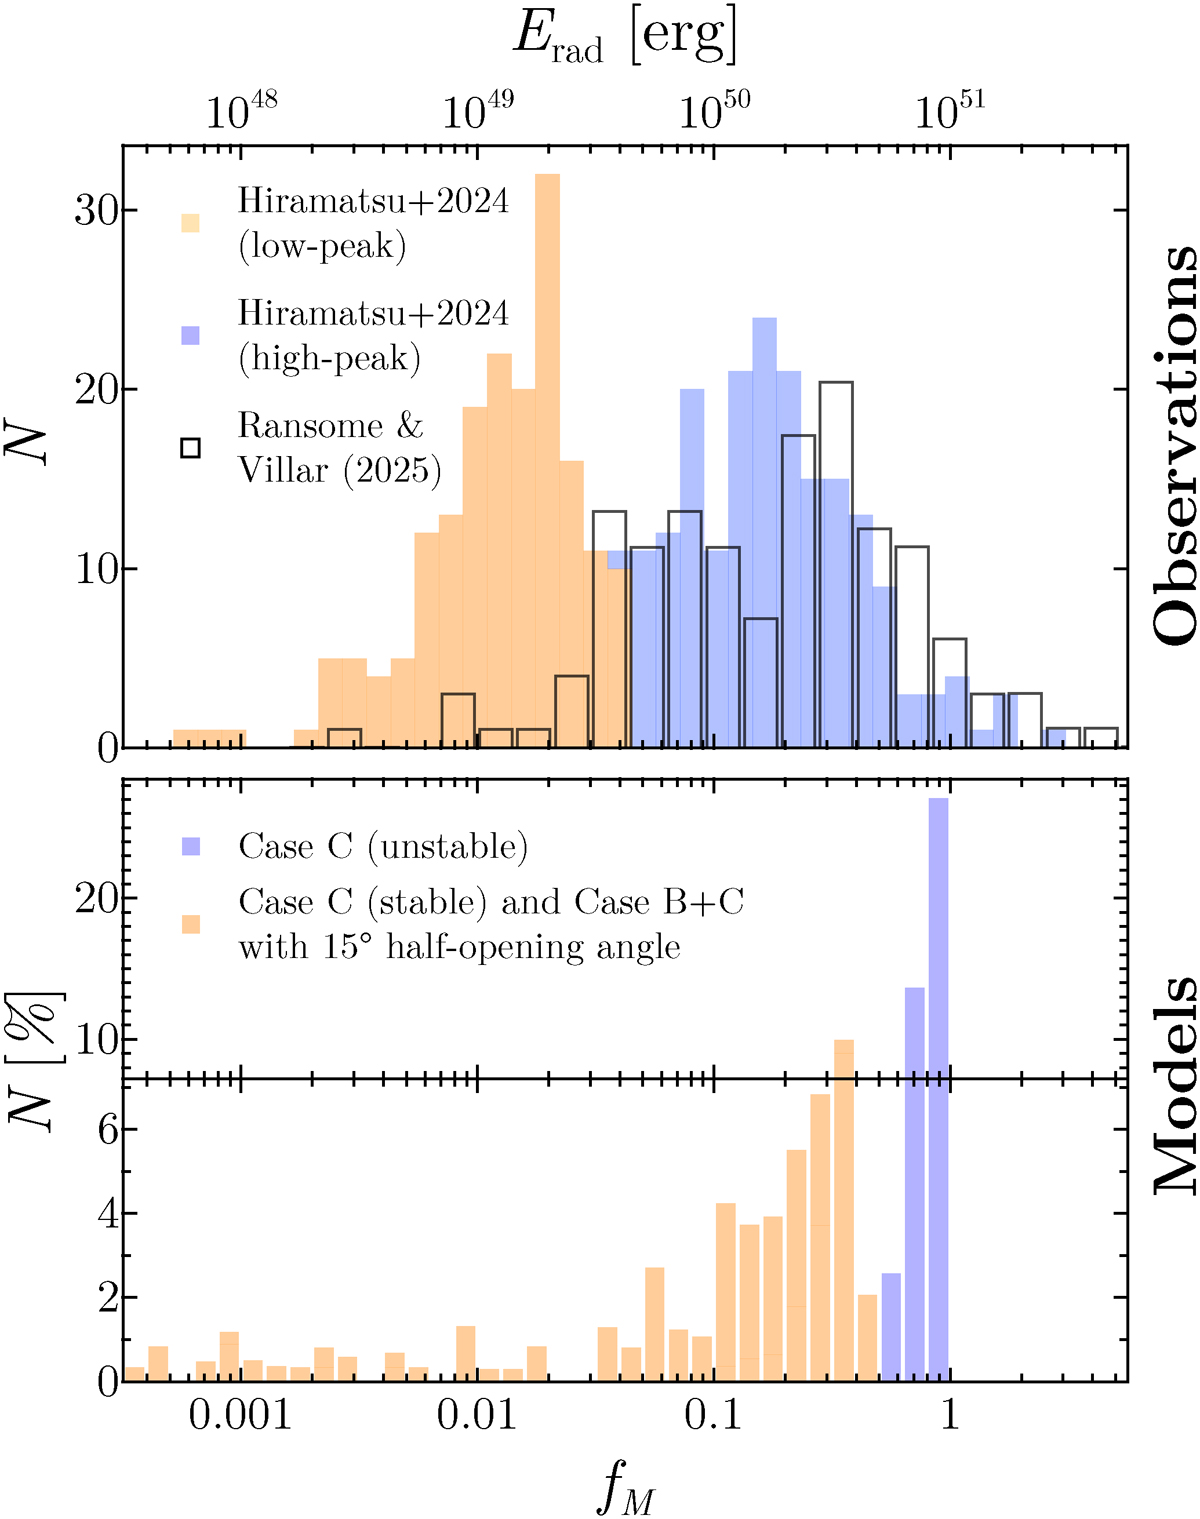
Fig. 4.
Download original image
Comparison of the distribution of the integrated bolometric light-curve luminosity Erad of observed Type IIn supernovae (top) and the conversion efficiency fM from our models (bottom). The data from Hiramatsu et al. (2024) distinguish between a high-luminosity group (Erad ∼ 1.8 × 1050 erg, blue) and a low-luminosity group (Erad ∼ 1.4 × 1049 erg, orange), while that of Ransome & Villar (2025) is derived via MOSFIT by fitting and integrating the bolometric light curve for each transient until day 200 after the explosion. The data from Ransome & Villar (2025) were normalized to the total number of transients they analyzed.
Current usage metrics show cumulative count of Article Views (full-text article views including HTML views, PDF and ePub downloads, according to the available data) and Abstracts Views on Vision4Press platform.
Data correspond to usage on the plateform after 2015. The current usage metrics is available 48-96 hours after online publication and is updated daily on week days.
Initial download of the metrics may take a while.