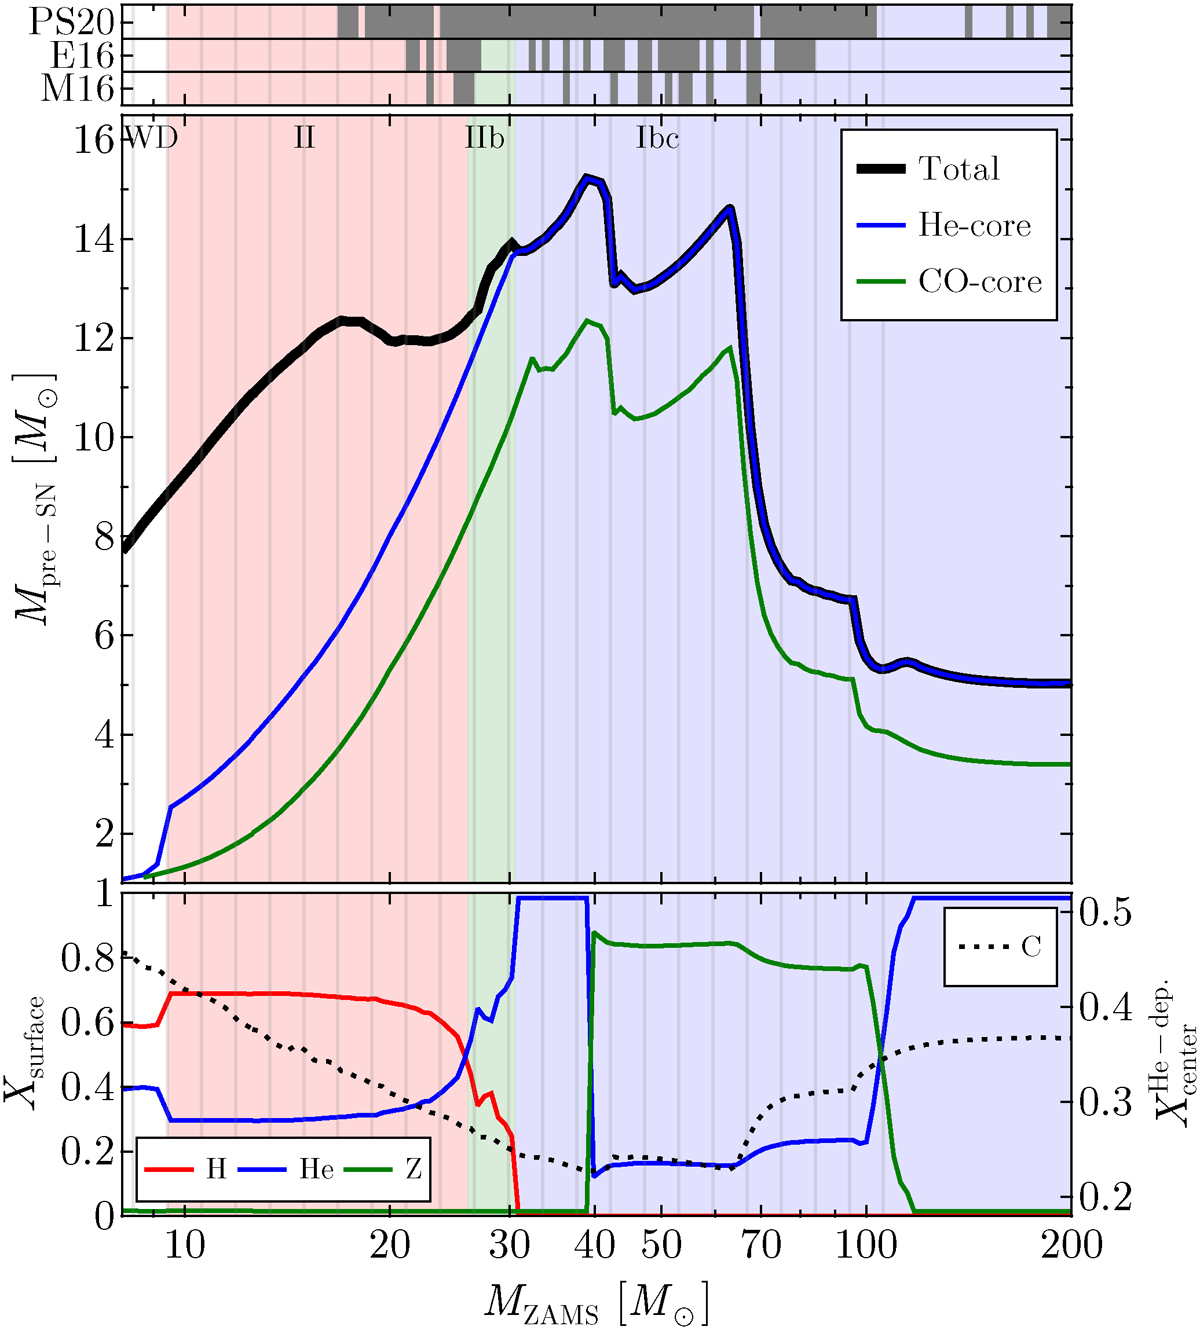
Fig. B.1.
Download original image
The features of single star models in grid CC-S at the end of the run. The middle panel shows the final mass (black), He-core mass (blue) and CO-core mass (green). The bottom panel shows the surface composition (solid lines, left axis) and the central C abundance at core He-depletion (dotted line, right axis). The top panel highlights the models that are expected to implode (black background), for different explodability criteria. Background colors show the expected evolutionary outcome of a model in that mass range, either WD (white), Type IIP/L (red), Type IIb (green) or Type Ibc supernova (blue).
Current usage metrics show cumulative count of Article Views (full-text article views including HTML views, PDF and ePub downloads, according to the available data) and Abstracts Views on Vision4Press platform.
Data correspond to usage on the plateform after 2015. The current usage metrics is available 48-96 hours after online publication and is updated daily on week days.
Initial download of the metrics may take a while.