| Issue |
A&A
Volume 706, February 2026
|
|
|---|---|---|
| Article Number | A343 | |
| Number of page(s) | 8 | |
| Section | Galactic structure, stellar clusters and populations | |
| DOI | https://doi.org/10.1051/0004-6361/202558445 | |
| Published online | 24 February 2026 | |
Kinematics of young star clusters in the outer northeastern region of the Small Magellanic Cloud
1
Instituto Interdisciplinario de Ciencias Básicas (ICB), CONICET-UNCuyo,
Padre J. Contreras 1300,
M5502JMA,
Mendoza,
Argentina
2
Consejo Nacional de Investigaciones Científicas y Técnicas (CONICET),
Godoy Cruz 2290,
C1425FQB
Buenos Aires,
Argentina
★ Corresponding author: This email address is being protected from spambots. You need JavaScript enabled to view it.
Received:
6
December
2025
Accepted:
23
January
2026
Abstract
It has recently been suggested that the magnitude of the interaction between galaxies could be measured from the level of kinematic disturbance of their outer regions with respect to the innermost ones. In this work, I proved that the outer northeastern region of the Small Magellanic Cloud (SMC), a relatively recent stellar structure with a tidal origin from the interaction with the Large Magellanic Cloud (LMC), is imprinted by a residual velocity pattern. I obtained mean radial velocities (RVs) of star clusters formed in situ from GEMINI GMOS spectra, which, added to derived mean proper motions and heliocentric distances, allowed me to compute their 3D space-velocity components. These space velocities are different from those that the clusters would have if they instead rotated with the galaxy in an orderly fashion; i.e., their residual velocities are larger than the upper limit for an object pertaining to the SMC’s main body rotation disk. The level of kinematic disturbance depends on the SMC rotation disk adopted; galaxy rotation disks traced using relatively old objects are discouraged. The resulting kinematic disturbance arises in younger and older stellar populations, so the epoch of close interaction between both Magellanic Clouds cannot be uncovered on the basis of the kinematics behavior of stellar populations in the outer SMC regions.
Key words: techniques: spectroscopic / galaxies: individual: SMC / galaxies: star clusters: general
© The Authors 2026
 Open Access article, published by EDP Sciences, under the terms of the Creative Commons Attribution License (https://creativecommons.org/licenses/by/4.0), which permits unrestricted use, distribution, and reproduction in any medium, provided the original work is properly cited.
This article is published in open access under the Subscribe to Open model. This email address is being protected from spambots. You need JavaScript enabled to view it. to support open access publication.
1 Introduction
In recent years, the tidal interaction between galaxies has become an issue of interest to further our understanding of their formation and evolution histories. One of the features of such tidal interactions is the presence of an internal galactic kinematics pattern, which shows increasing velocity dispersion toward the outermost galactic regions with respect to that in the innermost ones. For instance, Martínez-García et al. (2023) found that dwarf spheroidal satellites of the Milky Way present velocity gradients along the line of sight, indicating that the interaction with the Milky Way is causing them. To draw such a conclusion, they combined proper motions from Gaia data release 3 (DR3) (Gaia Collaboration 2016; Babusiaux et al. 2023) and line-of-sight velocities from the literature to derive their 3D internal kinematics.
In this context, the outermost regions of the Small Magellanic Cloud (SMC), particularly those facing the Large Magellanic Cloud (LMC), are expected to have experienced the effects of the mutual tidal interaction more intensively than its stellar innermost component, which exhibits an orderly rotational motion (see, e.g., Niederhofer et al. 2018; Zivick et al. 2018; Di Teodoro et al. 2019, and references therein); however, the observed gaseous component does not show evidence of ordered rotation (Murray et al. 2019; Rathore et al. 2025). The velocity gradient for the SMC has not been estimated yet (with the exception of one estimate by Zivick et al. 2021), but it represents a fundamental contribution to our knowledge of the formation, evolution, and interaction of this pair of galaxies.
Martínez-Delgado et al. (2019) studied the nature of a stellar structure (also called shell region) located 8° northeast of the SMC and concluded that it formed in a recent star formation event, likely triggered by an interaction with the LMC. They also showed that the only nine star clusters projected onto that structure are young and compatible with being part of it. Piatti (2022) used the Survey of the MAgellanic Stellar History (SMASH; Nidever et al. 2021) database to derive ages and distances of these star clusters and confirmed that they are young and span a heliocentric distance range ~3 times the depth of the SMC’s main body. Both their youth and their large distance range along the same line of sight favor the tidal origin of this northeastern stellar structure, making it suitable to investigate whether their kinematics are different from these of the rotating inner-SMC main body.
If the kinematics of this outermost SMC region were affected by tidal effects, it should show a kinematics that departs from that of the rotating inner disk extrapolated toward this outermost region. Based on this, 3D velocities of star clusters aligned along the line of sight of the northeastern stellar structure are important: 1) they add a valuable puzzle piece to the kinematics of the SMC at a large distance from its center; 2) they help us to understand at what level the interaction of the SMC with the LMC affects its kinematics; and 3) they contribute to building a comprehensive map of the kinematic behavior of the SMC’s outermost regions, which is still lacking (see, e.g., Sloan Digital Sky Survey V: Kollmeier et al. 2019). Note that by kinematically studying these young clusters we improve our knowledge of the recent SMC formation, evolution, and tidal interaction. In this work, I made use of spectroscopic and astrometric data to study the kinematics of star clusters in order to address this issue. Section 2 describes the collection and processing of the acquired spectroscopic data, Section 3 deals with the estimation of mean star clusters’ radial velocities, and Section 4 is devoted to the analysis of the derived 3D star cluster velocities. Section 5 summarizes the main conclusions of this work.
2 Observational data
I used the GEMINI GMOS-S spectrograph in multi-object mode to obtain spectra with the grism B1200 (central λ ~ 5000 Å, spectral range 4200–5800 Å, dispersion 0.26 Å/pix) of stars in the fields of the SMC young star clusters HW 64, IC 1655, and IC 1660 (30–105 Myr; Piatti 2022), respectively. Stars were selected based on the membership probabilities of Piatti (2022), including stars only brighter than g = 20 mag. I obtained 3×510 s exposures using a manufactured mask for each star cluster field through program GS-2025B-Q-101 (PI: Illesca). The collection of images included Cu-Ar arc lamps and flat-fields obtained before or after each individual science spectrum, as well as nightly bias series and observations of spectrophotometric standard stars. Figures 1–3 show the positions in the sky of the observed stars and their loci in the SMASH color-magnitude diagram (CMD).
The spectral images were reduced using the GEMINI task package1 within the IRAF2 environment. Science images were trimmed and corrected by overscan, bias, flat-field, and mosaiced. Then, the slits were properly cut so that the star spectra appeared centered on them. The mosaiced spectral images were wavelength calibrated; from these, the individual star spectra, which were previously being background subtracted, were extracted; finally, they were flux calibrated. I combined the three individual spectra per star in order to remove cosmic rays and increase the spectra’s S/N. I employed the resulting spectra to measure the radial velocity (RV) using the Hβ spectral line and the FXCOR task within IRAF. I applied the corresponding correction to attain heliocentric RVs. I derived RVs for most of the observed stars, whose values are listed in Table B.1 alongside the respective S/N, the celestial equatorial coordinates, and the observed SMASH g, i photometry.
3 Mean star clusters’ radial velocities
In order to estimate the mean star clusters’ RVs, I took advantage of the fact that a cluster member not only has an RV similar to the mean value of the cluster, it is also placed along the star-cluster sequence in the CMD (see Figure 2 in Piatti 2022). These two parameters – the RV and the distance to the ridge line of the cluster sequence in the CMD– are characterized by showing overdensities of cluster members in that 2D plane. This means that any Gaussian mixture model can be applied to disentangle cluster members from field stars.
I computed the distance of each observed star to the theoretical isochrone of the respective cluster (see Figures 1–3) using the following expression:
![Mathematical equation: $\[d=\sqrt{\left((g-i)-(g-i)_{\mathrm{iso}}\right)^2+k \times\left(g-g_{\mathrm{iso}}\right)^2},\]$](/articles/aa/full_html/2026/02/aa58445-25/aa58445-25-eq1.png)
where g and (g − i) are the SMASH observed magnitudes and colors (see Table B.1) and giso and (g − i)iso are the theoretical ones with the respective cluster reddening and distance modulus applied. I employed the cluster parameters (age, reddening, distance, and metallicity) derived by Piatti (2022). The parameter k is a factor that put magnitudes and colors on the same scale. In this case, I adopted k= 0.5. In practice, for each (g, g − i) pair I computed d using many points along the theoretical isochrone and chose the giso and (g − i)iso values that minimized d. To assist the reader, I called d the scaled CMD distance. The uncertainties in d were computed by propagating the errors in g and g − i.
Figure 4 depicts the distribution of the measured stars in the RV-versus-scaled CMD distance plane. As can be seen, the observed sample of stars includes field stars spanning the entire ranges of RV and scaled CMD distance and groups of stars that resemble those of cluster members. Field stars are seen placed along the cluster’s line of sight; they are mixed with cluster members but have different RVs from the cluster’s stars and positions in the CMD that are out of the cluster sequences. Likewise, it is possible to find field stars with RVs similar to those of the cluster or close to the cluster’s sequences in the CMD.
In order to detect any overdensity in the panels of Figure 4, which in turn provide the mean clusters’ RVs, I used the Hierarchical Density-Based Spatial Clustering of Applications with Noise (HDBSCAN McInnes et al. 2017) Gaussian mixture model technique. The min_cluster_size parameter was varied between 3 and 8 dex in steps of 1 dex, until it reached an optimum value where the number of selected stars remained constant. Since each observed cluster field contains only one star cluster, the respective RV-versus-scaled CMD distance plane should consequently harbor only one overdensity. For this reason, I considered allow_single_cluster=True during the execution of HDBSCAN. Figure 4 shows the stars found by HDBSCAN that exhibit clustering with magenta circles. I also highlight them among all the measured stars in Figures 1–3 with filled magenta symbols. As can be seen, all of them are within 0.10 mag of the corresponding CMD cluster sequence. From the selected clustered stars, I estimated the mean clusters’ RVs. Table 1 lists the reddening (E(B − V)), true-distance-modulus (m − Mo), age, and metallicity (Z) values for the three studied clusters, which were taken from Piatti (2022), together with the mean cluster RVs and the final number of confirmed cluster members identified from which the mean RVs were calculated. As far as I am aware, there are no previous mean-star-cluster RV estimates.
4 Analysis and discussion
With the aim of computing the 3D velocity components of HW 64. IC 1655, and IC 1660, I first derived the mean clusters’ proper motions. For that purpose, I downloaded DR3 RA and Dec coordinates, parallaxes (ϖ), and proper motions in RA and Dec (pmra, pmdec) with their associated uncertainties, as well as G, BP, and RP magnitudes of stars located inside circles with a radius of 4 arcmin from the centers of these three star clusters from Gaia. I restricted the data to those with errors in both proper motions of <0.1 mas/yr, ruwe < 1.4 (Ripepi et al. 2019) and excluded confirmed nearby stars; i.e., |ϖ| < 3σ(ϖ) (see Vasiliev 2018). Then, I built the clusters’ CMDs and measured the scaled CMD distances, d, as described in Section 3, using the Gaia theoretical isochrones (Bressan et al. 2012, PARSEC v1.2S). Finally, I fed HDBSCAN with the collected data for three variables: pmra, pmdec, and d, and identified the groups of stars satisfying cluster overdensity in that 3D phase space. The resulting mean clusters’ proper motions are listed in Table 1 alongside the number of stars used to compute them.
Piatti (2021b) used derived proper motions and RVs available in the literature of 25 SMC star clusters and the transformation Eqs. (9), (13), and (21) of van der Marel et al. (2002) to search for the kinematic model that best represents the motion of that cluster sample. The authors fit the RA and Dec, the heliocentric distance, the proper motion, and the systemic velocity of the SMC center, in addition to the inclination, the position angle of the line of nodes, and the RV of the SMC disk. Table 2 lists the derived values. I employed the transformation equations and the rotation model mentioned above to compute both the 3D space velocity components of HW 64, IC 1655, and IC 1660, and those corresponding to points on the nominal SMC disk located at the clusters’ distances from the SMC center. In doing that, I used the obtained mean clusters’ RVs and proper motions and their heliocentric distances (D) estimated by Piatti (2022). The uncertainties were calculated using the measured errors in proper motion and radial velocity, and those from the model solution for the 3D movement of the SMC center, propagated through the transformation equations and added in quadrature.
When both velocity vectors are subtracted from each other, and one calculates the modulus of the resulting vector, an index called residual velocity (ΔV) is obtained (Piatti 2021a). ΔV is meant to measure the magnitude of kinematic disturbance of star clusters with respect to an orderly rotation galaxy disk. The left panel of Figure 5 shows ΔV versus D for the three studied clusters and is represented by filled magenta circles (D = 63.0, 53.9, 57.9 kpc for HW 64, IC 1655, and IC 1660, respectively). I enlarged the sample of clusters genuinely belonging to the outer northeastern region of the SMC by searching the literature for the necessary information to compute ΔV. Thus, I added HW 56 (3.09 Gyr Dias et al. 2021) and NGC 458 (0.14 Gyr Song et al. 2021), which are shown as filled red circles in Figure 5. Bearing in mind the SMC center and line-of-sight depth obtained by Piatti (2021b), which are represented by solid and dashed vertical lines in Figure 5, respectively, and the boundary between bound and kinematically perturbed clusters (ΔV ~ 60 km s−1; Piatti 2021a), the five star clusters pertaining to the outer northeastern SMC structure would not seem to be perturbed by tidal effects from the LMC. Their ΔV values are on average below ~60 km s−1. However, ΔV depends on the SMC rotation disk adopted; so, a comprehensive analysis of the kinematics of the studied star clusters requires the consideration of different rotation disk models. Recently, Dhanush et al. (2025, and references therein) used Gaia DR3 datasets to derive kinematic parameters of different SMC stellar populations. Indeed, from a young to an old stellar population they found a change in the SMC disk inclination from ~82° down to ~58°, and in the position angle of the line of nodes (LON) from ~180° up to ~240°. Table 2 includes the values of the parameters adopted in this work for a representative young and old stellar population, making use of Dhanush et al. (2025)’s results. As for the SMC center proper motion, I adopted that of Niederhofer et al. (2021) for the optical center (de Vaucouleurs & Freeman 1972), which is in very good agreement with those from recent space-based data (Gaia Collaboration 2018; Zivick et al. 2018; De Leo et al. 2020) and with Dhanush et al. (2025).
For these two representative SMC rotation disks, I computed ΔV; I did the same for their uncertainties for the five studied star clusters in the outer northeastern structure, and the resulting ΔV versus D relationships are depicted in Figure 5 (middle and right panels). As can be seen, the kinematics of the studied clusters with respect to the orderly motion of the young stellar population (Niederhofer et al. 2018; Zivick et al. 2018; Di Teodoro et al. 2019) would seem to reveal a kinematic gradient, in the sense that smaller the heliocentric distance (which means the closer to the LMC), the larger the ΔV value. This outcome suggests that tidal interactions with the LMC (the studied clusters are relatively young) could have imprinted a certain agitation in their kinematics. This possibility would seem to be supported by the fact that the correlation of ΔV and D using the old star population’s kinematic model resulted to be similar to that from the cluster-rotation model. Indeed, the 25 SMC clusters used by Piatti (2021b) to uncover their own kinematic model are intermediate-to-old globular clusters (age > 1 Gyr). In other words, the old star population’s rotation disk is based on the motions of perturbed stars located in the outer SMC regions, and hence no readily visible gradient is seen in the left and right panels of Figure 5.
Hota et al. (2024) recently analyzed Ultra Violet Imaging Telescope (UVIT; Tandon et al. 2017) data and Gaia Early DR3 data of stars in the shell region in the northeastern SMC. They split the star sample into three age groups: stars younger than 150 Myr; stars with ages between 150 and 300 Myr; and stars older than 300 Myr. They aimed to probe the kinematics of stars formed before and after the recent interaction between the LMC and the SMC ~250 Myr ago (Choi et al. 2022). They found no apparent kinematic distinction among the three age groups, concluding that they did not find any evidence of tidal perturbation or disruption in this part of the SMC. However, the lack of distinction between proper motions of stars belonging to the northeastern shell with different ages is in agreement with the present findings. The stellar populations formed in a region affected by galactic tides – as in the case of the outer northeastern region of the SMC – are kinematically perturbed by those tides. In the case of older stellar populations, they were perturbed by tides because they were there when the tidal interactions occurred; for the younger populations, the kinematics’ disturbance comes from the gasses out of which they formed, which were also sealed by that kinematic agitation. As shown in Figure 5 (right panel), young clusters and old star populations have similar kinematics in the outer northeastern SMC shell (ΔV < 60 km s−1), while the motions of these clusters become visibly different (ΔV > 60 km s−1) when they are compared to those of an orderly rotation disk extrapolated to the outer SMC regions.
I finally computed the anisotropy (Bennet et al. 2022):
![Mathematical equation: $\[\beta=1-\frac{\left(\sigma V_r\right)^2+\left(\sigma V_z\right)^2}{2\left(\sigma V_\phi\right)^2},\]$](/articles/aa/full_html/2026/02/aa58445-25/aa58445-25-eq2.png) (1)
(1)
where σVr, σVϕ, and σVz are the dispersion in the three cylindrical velocity components, respectively. To obtain these quantities, I first calculated the 3D velocity components of the five star clusters in cylindrical coordinates with their respective uncertainties. Then, I used a maximum-likelihood approach by optimizing the probability, ℒ, that the five star clusters with velocities, Vi (V ≡ Vr, Vϕ, Vz), and errors, ei, are drawn from a population with a mean < V > and dispersion σ (e.g., Pryor & Meylan 1993; Walker et al. 2006) as follows:
![Mathematical equation: $\[\mathcal{L}=\prod_{i=1}^N\left(2 \pi\left(e_i^2+\sigma^2\right)\right)^{-\frac{1}{2}} \exp \left(-\frac{\left(V_i-<V>\right)^2}{2\left(e_i^2+\sigma^2\right)}\right),\]$](/articles/aa/full_html/2026/02/aa58445-25/aa58445-25-eq3.png) (2)
(2)
where the errors on the mean and dispersion were computed from the respective covariance matrices. As a result, I obtained σVr, σVϕ, and σVz with their corresponding uncertainties. Since the star clusters’ velocities were computed using a young and an old SMC kinematic disk as references (see Table 2), I finally obtained two different β values; namely, 0.06±0.01 (young disk) and −6.30±0.10 (old disk), where the mean and dispersion come from averaging a thousand values generated using a Monte Carlo technique for σVr= 12.2±0.1, σVϕ= 47.0±0.1, and σVz= 63.1±0.1 (young disk); and σVr= 13.9±0.5, σVϕ= 9.5±0.1, and σVz= 33.5±0.3 (old disk), respectively. I note that a negative value implies a low azimuthal dispersion, i.e., ordered rotation, which indicates similarity between the observations and the kinematic model. The resulting β values reveal that the kinematics of the five star clusters in the outer northeastern region is more similar to that of the old SMC disk rather than to that of the young disk.
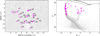 |
Fig. 1 Left: sky map with stars observed by SMASH (gray points) and those observed in this work (large magenta circles) in the field of HW 64; the symbol size is proportional to the g brightness of the star. Filled magenta circles represent cluster members (see details in Section 3). Right: SMASH CMD with the isochrone (Bressan et al. 2012, PARSEC v1.2S) corresponding to the distance, reddening, metallicity, and age of the cluster (Piatti 2022) superimposed. |
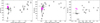 |
Fig. 4 RV-versus-scaled CMD distance of stars in HW 64 (left panel), IC 1655 (middle panel), and IC 1660 (right panel), respectively. The magenta circles represent the selected clustered stars. |
Astrophysical properties of studied SMC star clusters.
SMC rotation disk models.
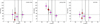 |
Fig. 5 ΔV versus heliocentric distance of young SMC clusters located in the northeastern shell region. The solid and dashed vertical lines represent the galaxy center and its depth according to the cluster rotation disk (Piatti 2021b), while the horizontal line represents a boundary between bound and kinematically perturbed clusters. Magenta and red filled circles represent the present studied clusters and those taken from the literature, respectively. A kinematic gradient is present when compared to a young stellar model (middle panel), but absent in comparison to the old stellar and cluster models (right and left panels), respectively (see text for details). |
5 Conclusions
The strength of tidal effects caused by the interaction between galaxies should be reasonably measured by the level of kinematic disturbance of the outermost galactic regions with respect to that in the innermost ones. This work aimed to confirm the above statement for the outer northeastern region of the SMC, where it is known that a recent stellar structure formed because of the interaction with the LMC (Martínez-Delgado et al. 2019; Piatti 2022; Dhanush et al. 2025). Since a number of young (≲200 Myr) star clusters also formed in this region during the interaction, I used a sample of them as kinematic tracers of that region and computed their residual velocities (ΔV).
To obtain ΔV values for HW 64, IC 1655, and IC 1660, three star clusters formed in the northeastern shell, I performed Gemini GMOS-S multi-object observations, from which the mean star clusters’ RVs were derived for the first time. The mean clusters’ proper motions were also derived using Gaia DR3 data. The 3D space velocity components were calculated by employing the derived mean proper motions and RVs, star clusters’ heliocentric distances taken from the literature, and the coordinates framework defined in van der Marel et al. (2002). The modulus of the vector difference between the cluster’s velocity and that of a point in the SMC’s rotating disk at the cluster distance from the SMC’s center represents the ΔV. The resulting ΔV values, to which I added those of two star clusters belonging to the northeastern shell with the necessary information available (HW 56 and NGC 458), led me to conclude the points listed below.
– When the SMC’s rotating disk fit by Piatti (2021b) using star clusters older than ~1 Gyr is used as reference, the five studied star clusters would not seem to be kinematically perturbed. Their ΔV values are mostly <60 km s−1, an upper limit found by Piatti (2021a) for the residual velocity of the SMC’s main body. The apparent lack of kinematic disturbance would seem to be the result of employing, as a reference, a rotating disk that by itself is perturbed. A similar behavior is found if a rotating disk traced by old stellar populations is used.
– If an SMC disk rotating in an orderly manner and fitted using young stellar populations mainly distributed in the innermost galaxy regions is used as reference (e.g., Dhanush et al. 2025), the star clusters exhibit a clear residual velocity gradient, in the sense that the farther a cluster is from the SMC’s center (in this case, it also implies being closer to the LMC), the larger its residual velocity (see, Figure A.1). This outcome is a clear evidence that galactic tides kinematically affects the outer galactic regions.
– The above results are in excellent agreement with the recent study by Dhanush et al. (2025), the authors of which computed different SMC rotation disk parameters, employing a comprehensive sample of different stellar populations. Indeed, their results point to the existence of as many different rotation disks as galaxy stellar components used, and they highlight the prevailing orderly rotation motion in the innermost galaxy regions with respect to the outer ones, which are affected by tides.
– The results found in this work confirm that LMC tides kinematically affect the outer SMC regions, independently of the age of the stellar populations that populate those regions. This implies that the epoch of close interaction between both Magellanic Clouds cannot be uncovered from the kinematics of the outer SMC regions.
Acknowledgements
I thank the referee for the thorough reading of the manuscript and timely suggestions to improve it. Based on observations obtained at the international GEMINI Observatory, a program of NSF NOIRLab, which is managed by the Association of Universities for Research in Astronomy (AURA) under a cooperative agreement with the U.S. National Science Foundation on behalf of the GEMINI Observatory partnership: the U.S. National Science Foundation (United States), National Research Council (Canada), Agencia Nacional de Investigación y Desarrollo (Chile), Ministerio de Ciencia, Tecnología e Innovación (Argentina), Ministério da Ciência, Tecnologia, Inovações e Comunicações (Brazil), and Korea Astronomy and Space Science Institute (Republic of Korea). This work has made use of data from the European Space Agency (ESA) mission Gaia (https://www.cosmos.esa.int/gaia), processed by the Gaia Data Processing and Analysis Consortium (DPAC, https://www.cosmos.esa.int/web/gaia/dpac/consortium). Funding for the DPAC has been provided by national institutions, in particular the institutions participating in the Gaia Multilateral Agreement. Data for reproducing the figures and analysis in this work will be available upon request to the author.
References
- Babusiaux, C., Fabricius, C., Khanna, S., et al. 2023, A&A, 674, A32 [NASA ADS] [CrossRef] [EDP Sciences] [Google Scholar]
- Bennet, P., Alfaro-Cuello, M., Pino, A. d., et al. 2022, ApJ, 935, 149 [Google Scholar]
- Bressan, A., Marigo, P., Girardi, L., et al. 2012, MNRAS, 427, 127 [NASA ADS] [CrossRef] [Google Scholar]
- Choi, Y., Olsen, K. A. G., Besla, G., et al. 2022, ApJ, 927, 153 [NASA ADS] [CrossRef] [Google Scholar]
- De Leo, M., Carrera, R., Noël, N. E. D., et al. 2020, MNRAS, 495, 98 [Google Scholar]
- de Vaucouleurs, G., & Freeman, K. C. 1972, Vistas Astron., 14, 163 [Google Scholar]
- Dhanush, S. R., Subramaniam, A., & Subramanian, S. 2025, ApJ, 980, 73 [Google Scholar]
- Di Teodoro, E. M., McClure-Griffiths, N. M., Jameson, K. E., et al. 2019, MNRAS, 483, 392 [Google Scholar]
- Dias, B., Angelo, M. S., Oliveira, R. A. P., et al. 2021, A&A, 647, L9 [NASA ADS] [CrossRef] [EDP Sciences] [Google Scholar]
- Gaia Collaboration (Prusti, T., et al.) 2016, A&A, 595, A1 [NASA ADS] [CrossRef] [EDP Sciences] [Google Scholar]
- Gaia Collaboration (Brown, A. G. A., et al.) 2018, A&A, 616, A1 [NASA ADS] [CrossRef] [EDP Sciences] [Google Scholar]
- Hota, S., Subramaniam, A., Dhanush, S. R., Cioni, M.-R. L., & Subramanian, S. 2024, MNRAS, 532, 322 [Google Scholar]
- Kollmeier, J., Anderson, S. F., Blanc, G. A., et al. 2019, in Bulletin of the American Astronomical Society, 51, 274 [NASA ADS] [Google Scholar]
- Martínez-Delgado, D., Vivas, A. K., Grebel, E. K., et al. 2019, A&A, 631, A98 [NASA ADS] [CrossRef] [EDP Sciences] [Google Scholar]
- Martínez-García, A. M., del Pino, A., & Aparicio, A. 2023, MNRAS, 518, 3083 [Google Scholar]
- McInnes, L., Healy, J., & Astels, S. 2017, J. Open Source Softw., 2, 205 [NASA ADS] [CrossRef] [Google Scholar]
- Murray, C. E., Peek, J. E. G., Di Teodoro, E. M., et al. 2019, ApJ, 887, 267 [Google Scholar]
- Nidever, D. L., Olsen, K., Choi, Y., et al. 2021, AJ, 161, 74 [NASA ADS] [CrossRef] [Google Scholar]
- Niederhofer, F., Cioni, M.-R. L., Rubele, S., et al. 2018, A&A, 613, L8 [NASA ADS] [CrossRef] [EDP Sciences] [Google Scholar]
- Niederhofer, F., Cioni, M.-R. L., Rubele, S., et al. 2021, MNRAS, 502, 2859 [Google Scholar]
- Piatti, A. E. 2021a, MNRAS, 508, 3748 [Google Scholar]
- Piatti, A. E. 2021b, A&A, 650, A52 [NASA ADS] [CrossRef] [EDP Sciences] [Google Scholar]
- Piatti, A. E. 2022, MNRAS, 509, 3462 [Google Scholar]
- Pryor, C., & Meylan, G. 1993, in Astronomical Society of the Pacific Conference Series, 50, Structure and Dynamics of Globular Clusters, eds. S. G. Djorgovski, & G. Meylan, 357 [Google Scholar]
- Rathore, H., Besla, G., van der Marel, R. P., & Kallivayalil, N. 2025, arXiv eprints [arXiv:2512.06075] [Google Scholar]
- Ripepi, V., Molinaro, R., Musella, I., et al. 2019, A&A, 625, A14 [NASA ADS] [CrossRef] [EDP Sciences] [Google Scholar]
- Song, Y.-Y., Mateo, M., Bailey, J. I., et al. 2021, MNRAS, 504, 4160 [NASA ADS] [CrossRef] [Google Scholar]
- Tandon, S. N., Hutchings, J. B., Ghosh, S. K., et al. 2017, J. Astrophys. Astron., 38, 28 [Google Scholar]
- van der Marel, R. P., Alves, D. R., Hardy, E., & Suntzeff, N. B. 2002, AJ, 124, 2639 [NASA ADS] [CrossRef] [Google Scholar]
- Vasiliev, E. 2018, MNRAS, 481, L100 [Google Scholar]
- Walker, M. G., Mateo, M., Olszewski, E. W., et al. 2006, AJ, 131, 2114 [Google Scholar]
- Zivick, P., Kallivayalil, N., van der Marel, R. P., et al. 2018, ApJ, 864, 55 [Google Scholar]
- Zivick, P., Kallivayalil, N., & van der Marel, R. P. 2021, ApJ, 910, 36 [Google Scholar]
Appendix A Residual velocities
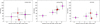 |
Fig. A.1 Same as Figure 5 using 3D distances from the SMC center, calculated using the models’ parameters of Table 2. |
Appendix B Spectroscopic data
All Tables
All Figures
|
Fig. 1 Left: sky map with stars observed by SMASH (gray points) and those observed in this work (large magenta circles) in the field of HW 64; the symbol size is proportional to the g brightness of the star. Filled magenta circles represent cluster members (see details in Section 3). Right: SMASH CMD with the isochrone (Bressan et al. 2012, PARSEC v1.2S) corresponding to the distance, reddening, metallicity, and age of the cluster (Piatti 2022) superimposed. |
| In the text | |
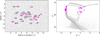 |
Fig. 2 Same as Figure 1, but for IC 1655. |
| In the text | |
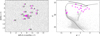 |
Fig. 3 Same as Figure 1, but for IC 1660. |
| In the text | |
|
Fig. 4 RV-versus-scaled CMD distance of stars in HW 64 (left panel), IC 1655 (middle panel), and IC 1660 (right panel), respectively. The magenta circles represent the selected clustered stars. |
| In the text | |
|
Fig. 5 ΔV versus heliocentric distance of young SMC clusters located in the northeastern shell region. The solid and dashed vertical lines represent the galaxy center and its depth according to the cluster rotation disk (Piatti 2021b), while the horizontal line represents a boundary between bound and kinematically perturbed clusters. Magenta and red filled circles represent the present studied clusters and those taken from the literature, respectively. A kinematic gradient is present when compared to a young stellar model (middle panel), but absent in comparison to the old stellar and cluster models (right and left panels), respectively (see text for details). |
| In the text | |
|
Fig. A.1 Same as Figure 5 using 3D distances from the SMC center, calculated using the models’ parameters of Table 2. |
| In the text | |
Current usage metrics show cumulative count of Article Views (full-text article views including HTML views, PDF and ePub downloads, according to the available data) and Abstracts Views on Vision4Press platform.
Data correspond to usage on the plateform after 2015. The current usage metrics is available 48-96 hours after online publication and is updated daily on week days.
Initial download of the metrics may take a while.