Open Access
Fig. 1.
Download original image
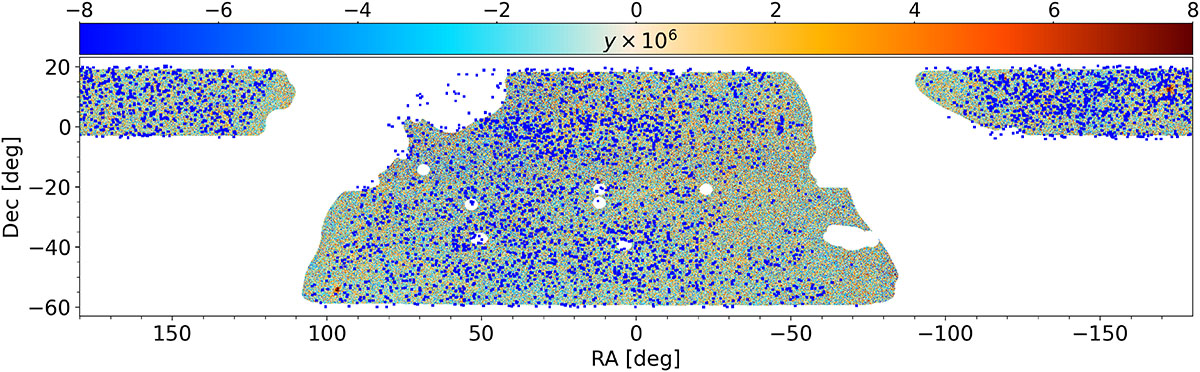
Visual representation of the dataset employed in this study. The ACT DR6 Compton parameter map is plotted on an equirectangular projection – the white region highlighting the mask footprint. The blue spots show the positions of the 4195 clusters from the ACT DR5 catalog.
Current usage metrics show cumulative count of Article Views (full-text article views including HTML views, PDF and ePub downloads, according to the available data) and Abstracts Views on Vision4Press platform.
Data correspond to usage on the plateform after 2015. The current usage metrics is available 48-96 hours after online publication and is updated daily on week days.
Initial download of the metrics may take a while.