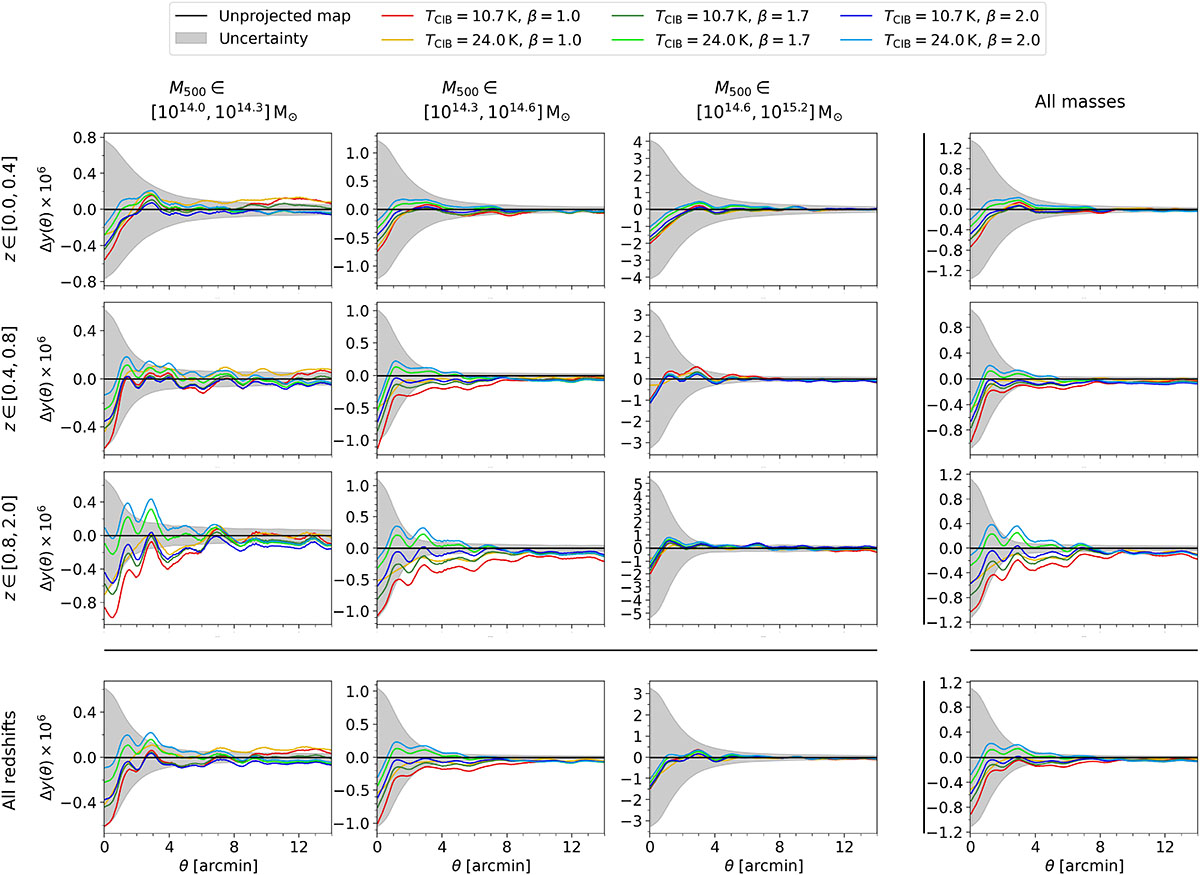
Fig. A.1.
Download original image
Effect of CIB contamination on the reconstructed profiles, shown as residuals Δy(θ) between the profiles obtained from the CIB de-projected maps, and the fiducial profiles obtained from the unprojected map. Results are shown for all the 16 cluster samples employed in this study, and for different versions of the CIB de-projected maps (as shown in the legend at the top). The uncertainties associated with the fiducial profiles are also shown as shaded gray regions.
Current usage metrics show cumulative count of Article Views (full-text article views including HTML views, PDF and ePub downloads, according to the available data) and Abstracts Views on Vision4Press platform.
Data correspond to usage on the plateform after 2015. The current usage metrics is available 48-96 hours after online publication and is updated daily on week days.
Initial download of the metrics may take a while.