Open Access
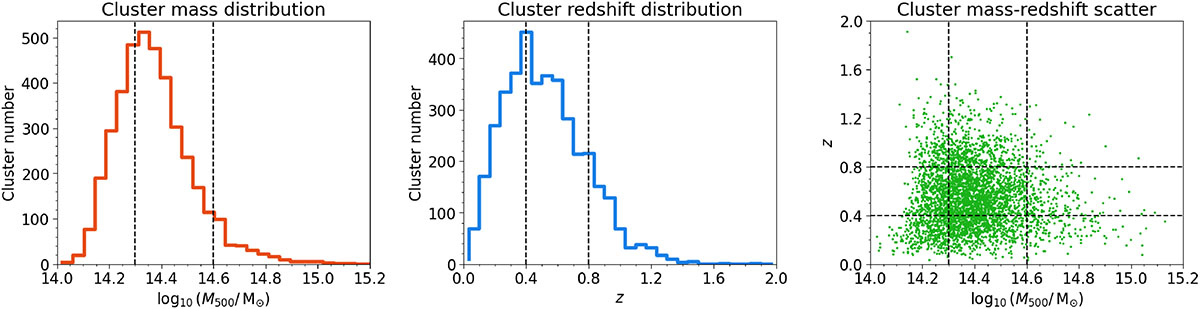
Fig. 2.
Download original image
Left and middle panels: distribution in mass and redshift of the full cluster sample adopted in this study. Right: catalog scatter across these two quantities. In all panels, the dashed lines mark the edges of the chosen bins in the corresponding quantity.
Current usage metrics show cumulative count of Article Views (full-text article views including HTML views, PDF and ePub downloads, according to the available data) and Abstracts Views on Vision4Press platform.
Data correspond to usage on the plateform after 2015. The current usage metrics is available 48-96 hours after online publication and is updated daily on week days.
Initial download of the metrics may take a while.