Fig. 6.
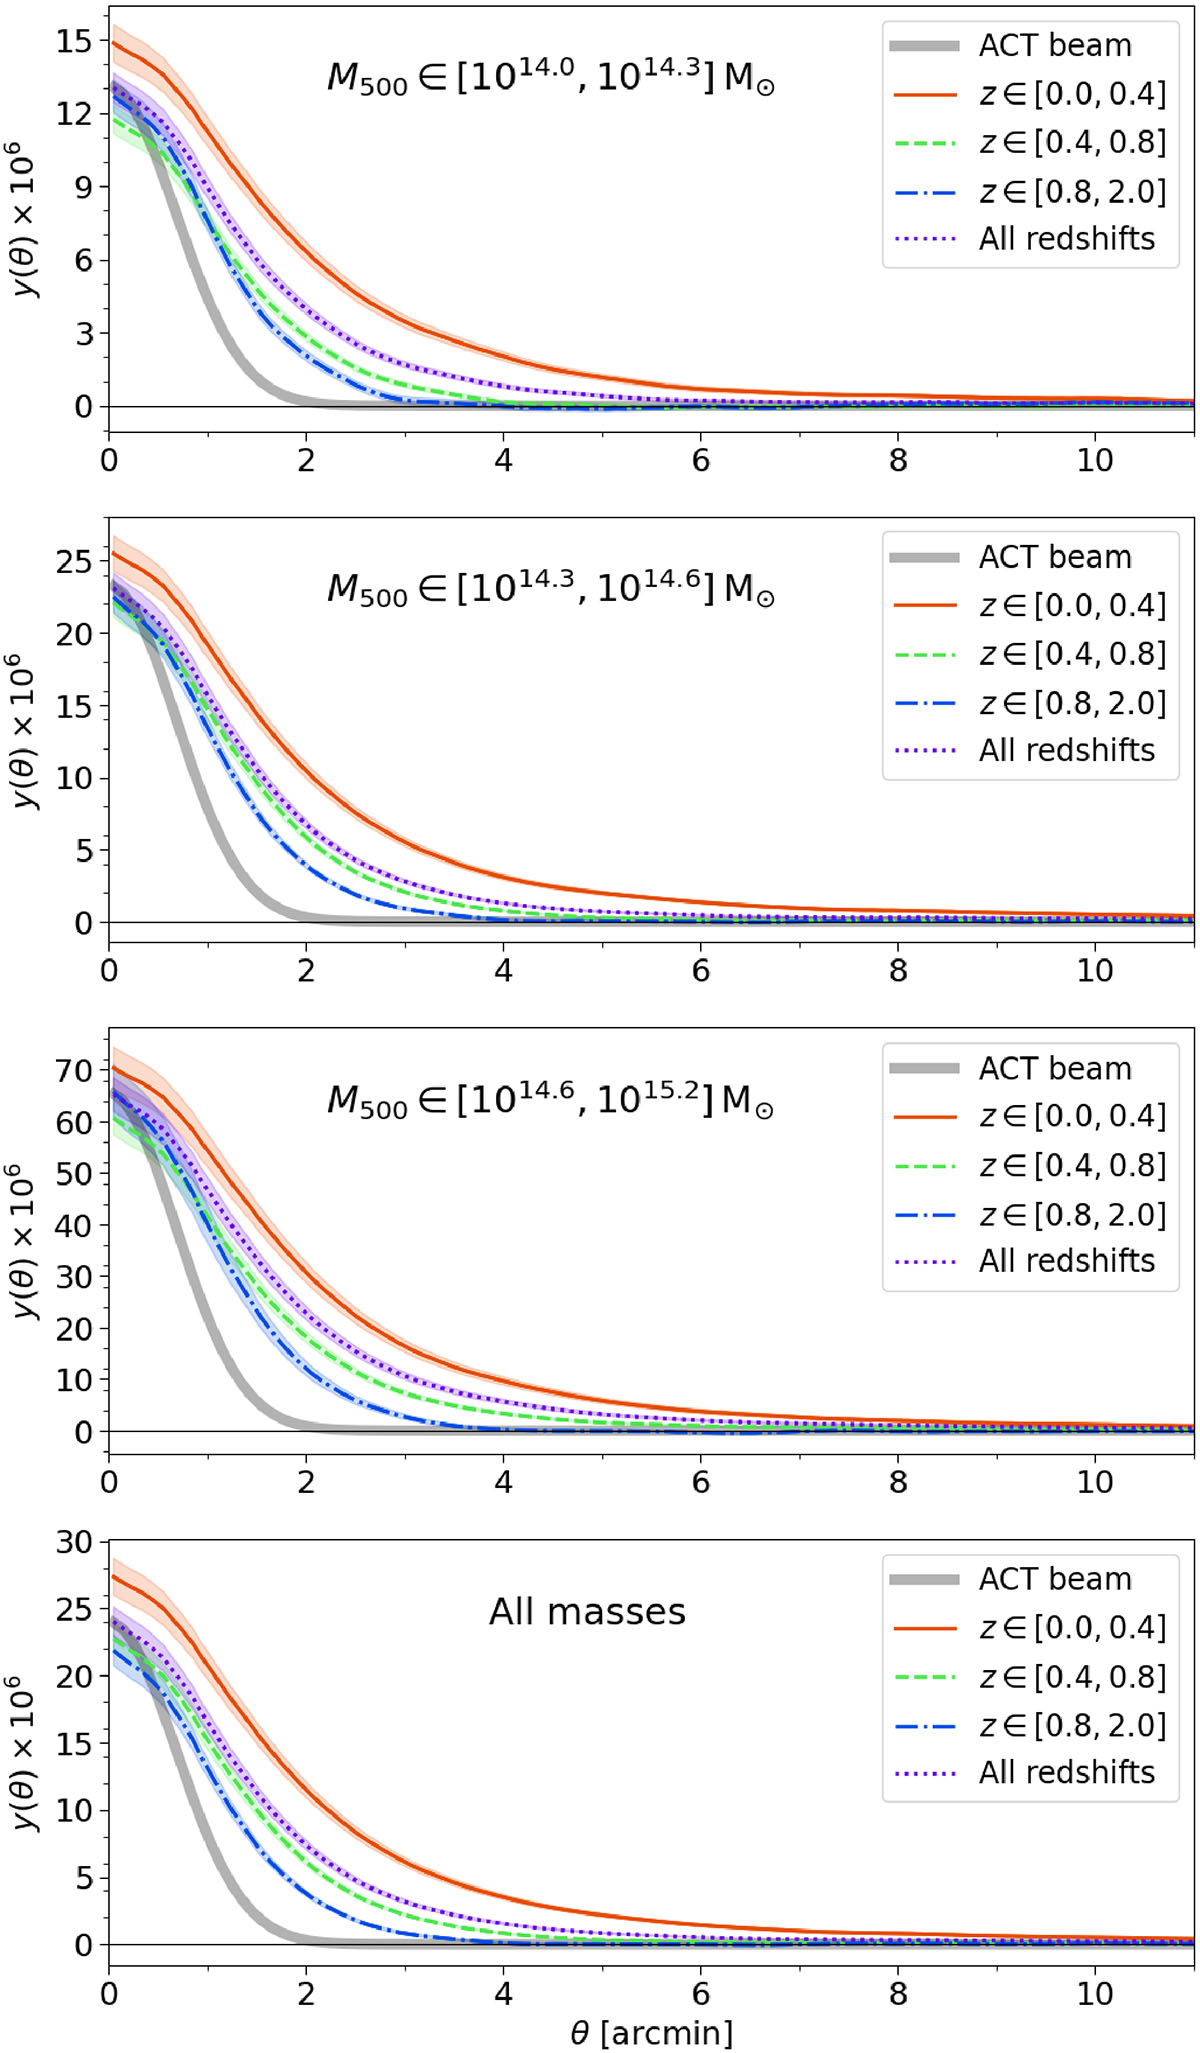
Download original image
Circularly symmetrized Compton parameter angular profiles extracted from the 16 stacks shown in Fig. 3, background subtracted, and showing the 1-sigma uncertainty per bin as a shaded region. Profiles are grouped according to their mass bin, showing different redshift bins in each panel. The ACT beam profile is included for comparison.
Current usage metrics show cumulative count of Article Views (full-text article views including HTML views, PDF and ePub downloads, according to the available data) and Abstracts Views on Vision4Press platform.
Data correspond to usage on the plateform after 2015. The current usage metrics is available 48-96 hours after online publication and is updated daily on week days.
Initial download of the metrics may take a while.