Open Access
Fig. 9.
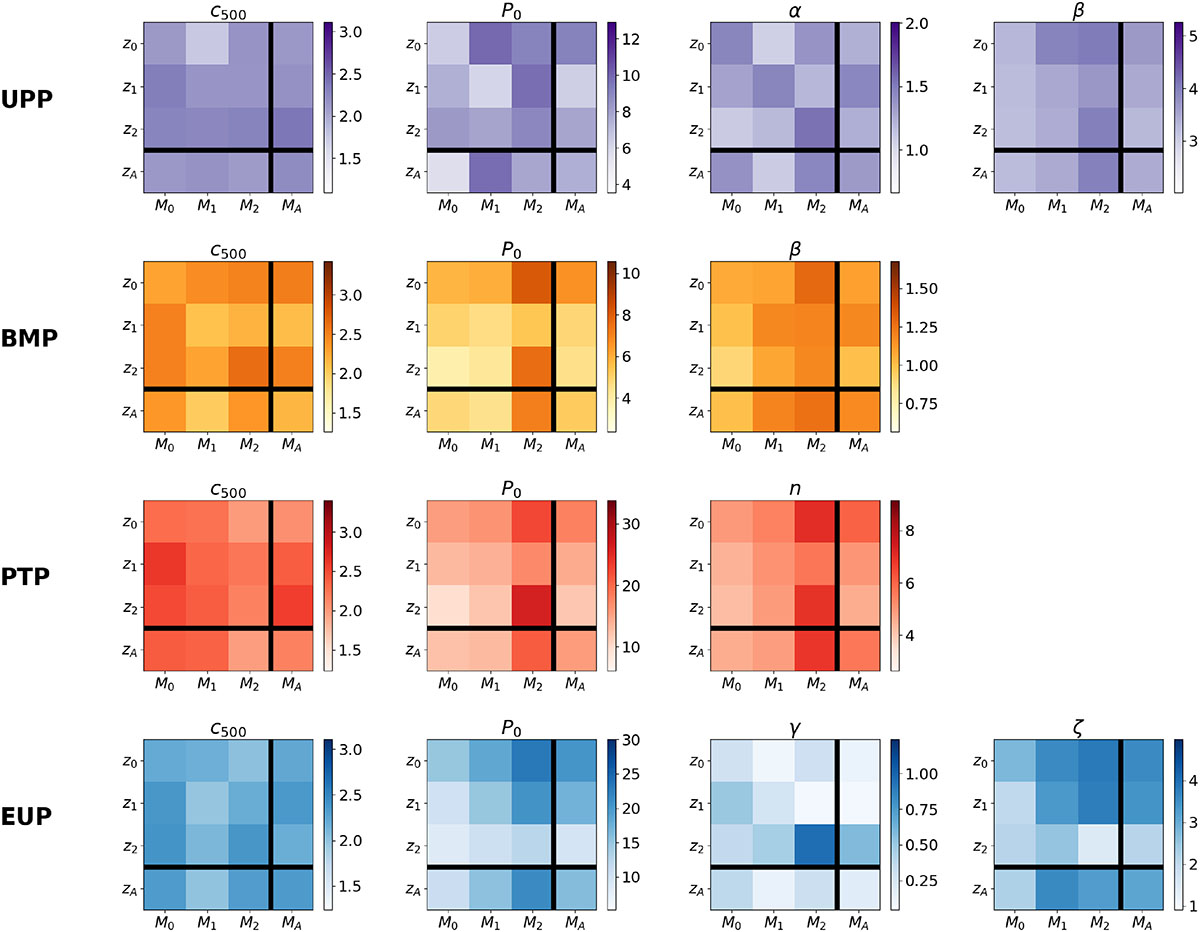
Download original image
Visual representation of the constrained parameters dependence on the chosen mass and redshift bin. Each row refers to a different theoretical model, and each plot to a specific parameter. Mass and redshift bins are labeled with a number subscript or with “A” for “All”.
Current usage metrics show cumulative count of Article Views (full-text article views including HTML views, PDF and ePub downloads, according to the available data) and Abstracts Views on Vision4Press platform.
Data correspond to usage on the plateform after 2015. The current usage metrics is available 48-96 hours after online publication and is updated daily on week days.
Initial download of the metrics may take a while.