Fig. 7
Download original image
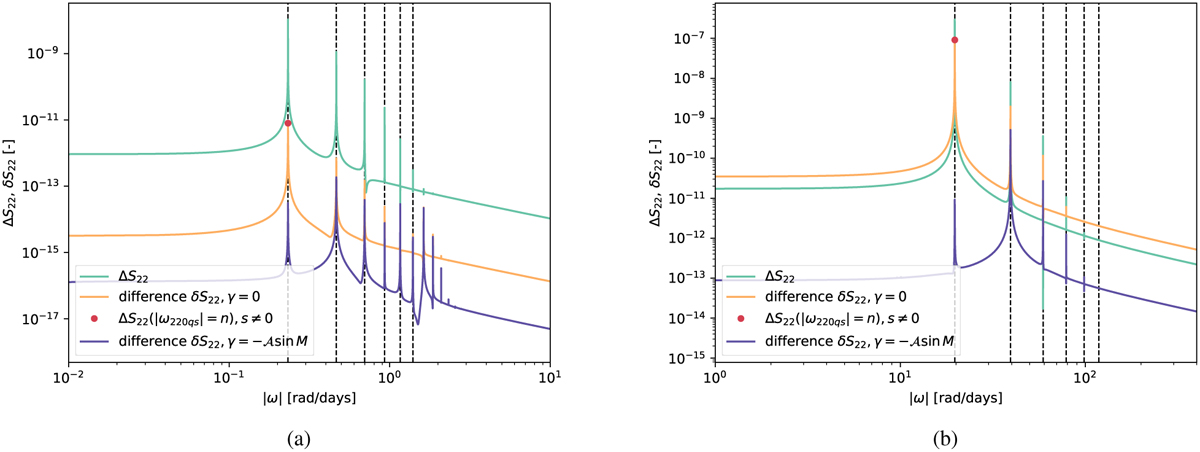
FFT of the differences between the numerical propagated gravity coefficients (coupled model) and the gravity field response predicted by the tidal potential theory (Eqs. (37)–(39)) for the Moon (panel a) and Phobos (panel b). The results are shown here for the ∆S22 variations, but ∆C22 exhibits the same behaviour. The dashed vertical black lines indicate the mean motion frequency and higher harmonics. The orange line represents the FFT obtained when the libration contribution is omitted in the tidal potential (fixing s = 0 in Eqs. (37)–(39)), while the purple line corresponds to the coefficient differences once the libration is accounted for. As a quantitative indication, we also provide the FFT of the propagated coefficients themselves (in green), which was already displayed in Figure 3. Finally, the red dot indicates the contribution of the once-per-orbit libration to the tidal response at the once-per-orbit forcing (showing great agreement with the peak of the gravity differences at this frequency in the no libration case).
Current usage metrics show cumulative count of Article Views (full-text article views including HTML views, PDF and ePub downloads, according to the available data) and Abstracts Views on Vision4Press platform.
Data correspond to usage on the plateform after 2015. The current usage metrics is available 48-96 hours after online publication and is updated daily on week days.
Initial download of the metrics may take a while.