Fig. 1
Download original image
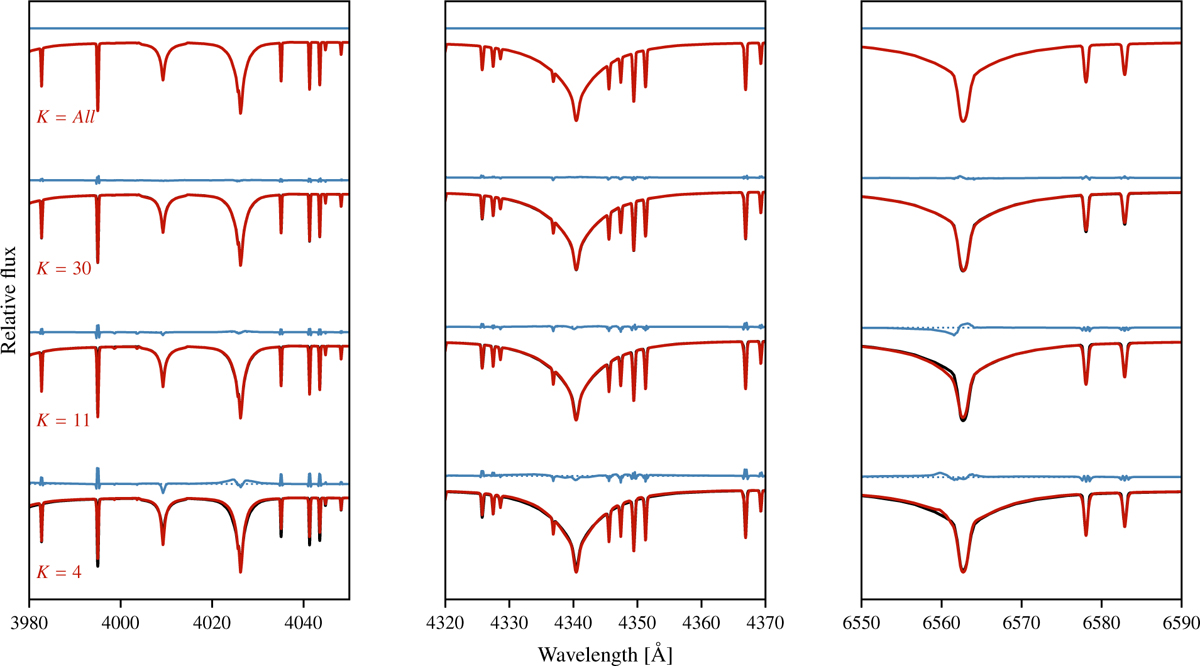
Reconstruction of a representative training spectrum for different truncation levels. Each panel corresponds to a wavelength range and displays the original spectrum (black) together with reconstructions obtained using K = 4, 11, 30, and all principal components (red), vertically offset for clarity. The blue curves show the corresponding residuals (reconstruction original) plotted above each case. The examples illustrate the progressive improvement in the reconstructed line profiles with increasing K. The −selected windows contain strong and weak diagnostic features (H, He, and metals), including the wind–sensitive Hα region.
Current usage metrics show cumulative count of Article Views (full-text article views including HTML views, PDF and ePub downloads, according to the available data) and Abstracts Views on Vision4Press platform.
Data correspond to usage on the plateform after 2015. The current usage metrics is available 48-96 hours after online publication and is updated daily on week days.
Initial download of the metrics may take a while.