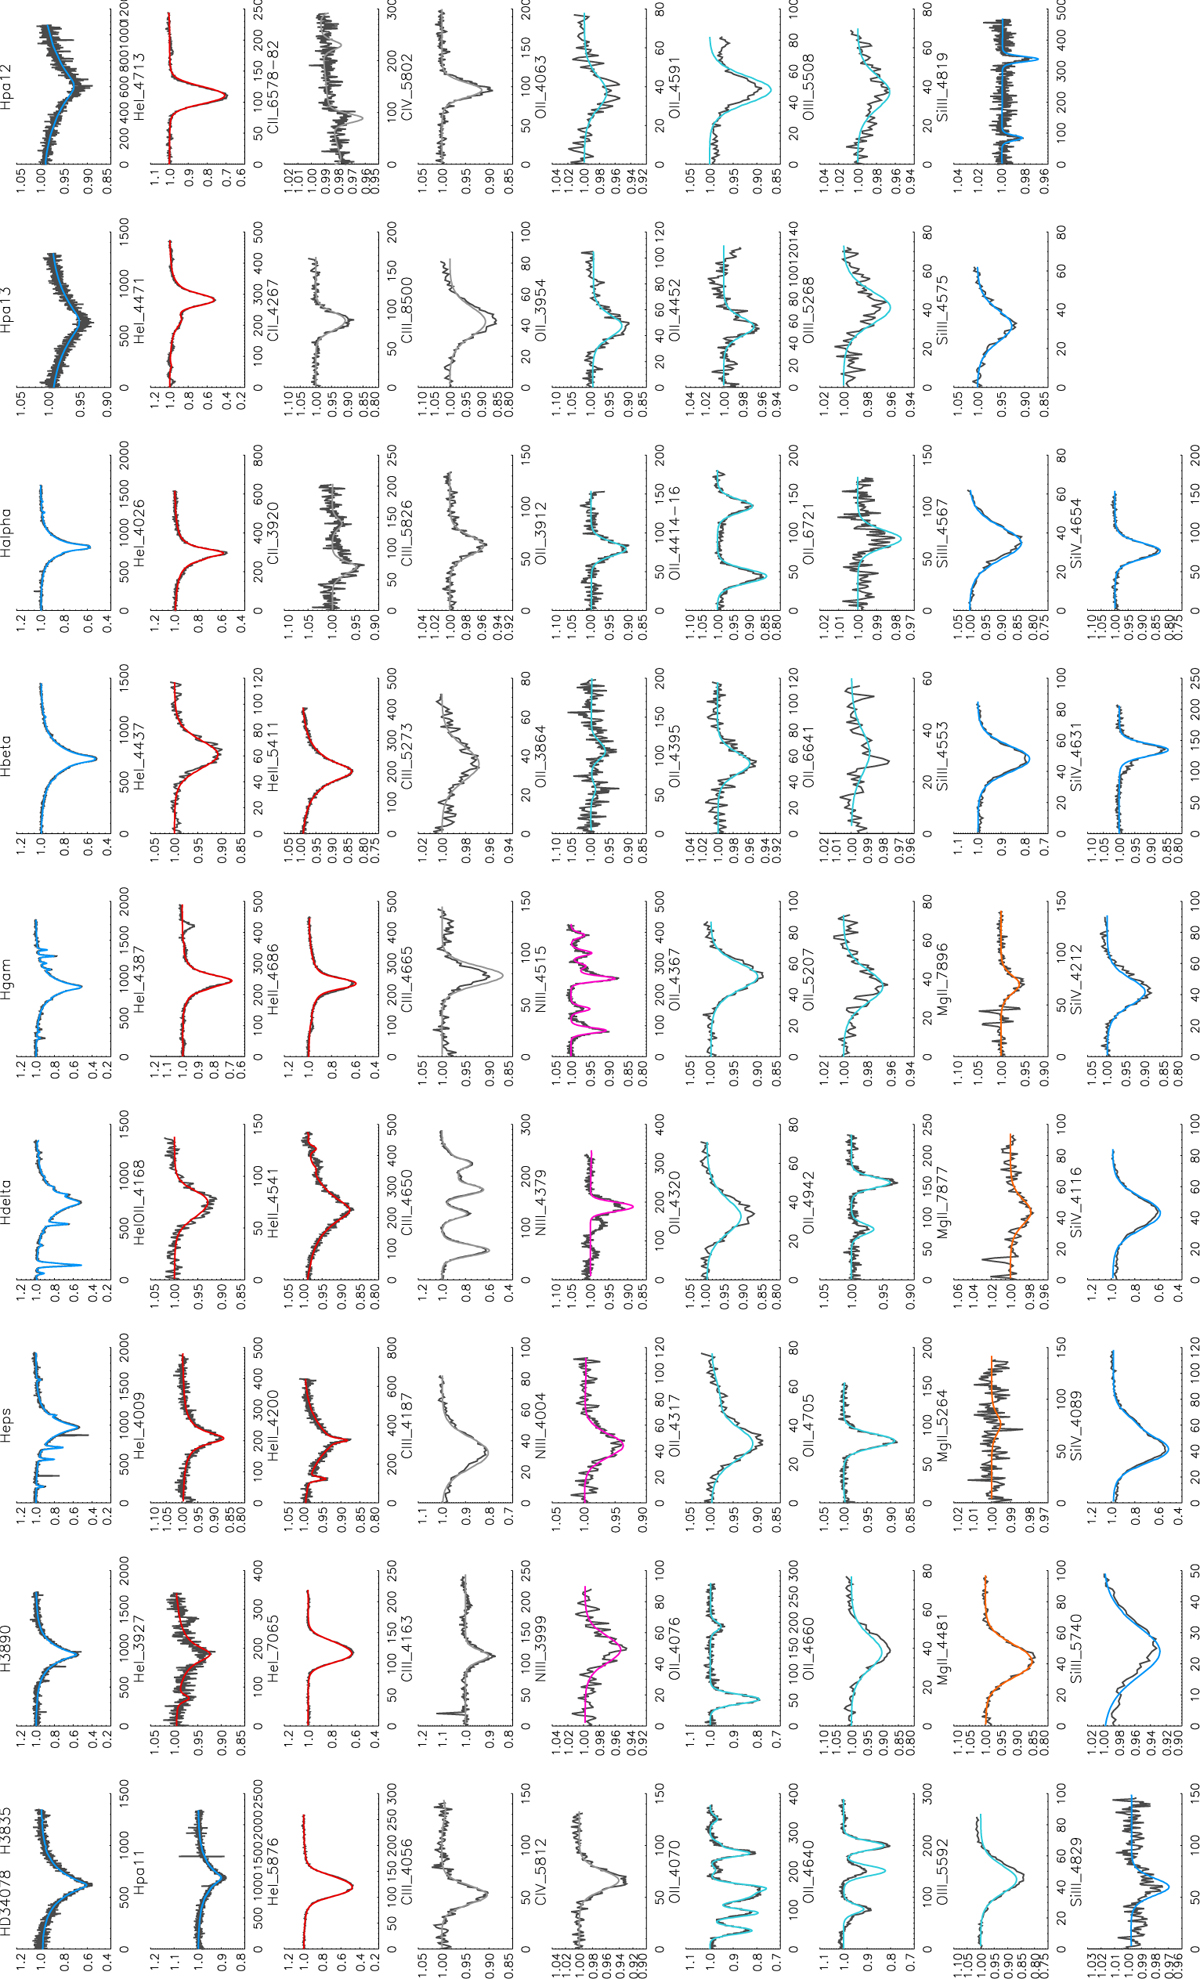
Fig. C.3
Download original image
HD 34078 (O9.5 V): comparison between the observed spectrum (black) and synthetic spectra (coloured) for selected diagnostic lines of H, He, C, N, O, Mg, and Si. The synthetic spectra were computed with FASTWIND using the stellar parameters and abundances obtained from the Bayesian analysis. The good agreement across multiple ions demonstrates the consistency of the inferred parameters and the robustness of the global fitting approach. The horizontal axis is given in pixel number rather than wavelength; the corresponding spectral ranges are indicated by the panel labels. The names identifying the sub-panels are orientative only: each panel may include several spectral features, and the label marks approximately the central wavelength of the region shown.
Current usage metrics show cumulative count of Article Views (full-text article views including HTML views, PDF and ePub downloads, according to the available data) and Abstracts Views on Vision4Press platform.
Data correspond to usage on the plateform after 2015. The current usage metrics is available 48-96 hours after online publication and is updated daily on week days.
Initial download of the metrics may take a while.