Open Access
Fig. 4
Download original image
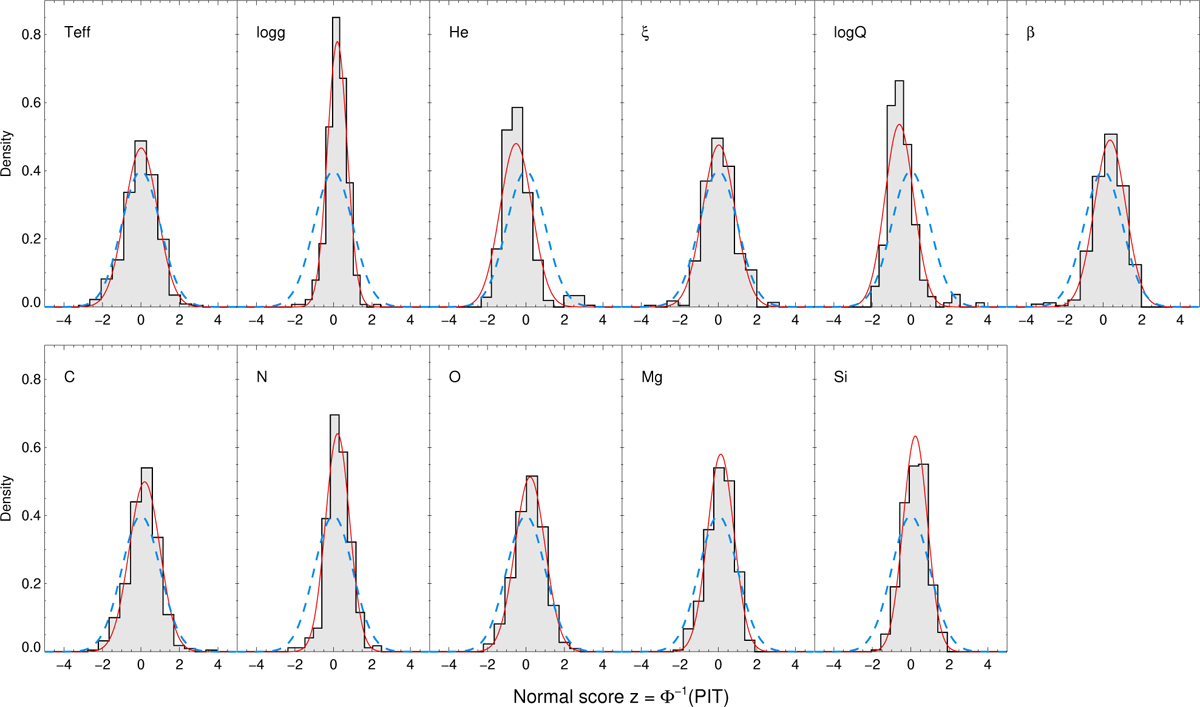
Calibration diagnostics using normal scores of the PIT. The panels show the empirical distributions of z for the difference parameters defining the emulator. The dashed blue curve marks the standard normal (0, 1), with the solid red line providing a kernel density estimate of the results.
Current usage metrics show cumulative count of Article Views (full-text article views including HTML views, PDF and ePub downloads, according to the available data) and Abstracts Views on Vision4Press platform.
Data correspond to usage on the plateform after 2015. The current usage metrics is available 48-96 hours after online publication and is updated daily on week days.
Initial download of the metrics may take a while.