Fig. 6
Download original image
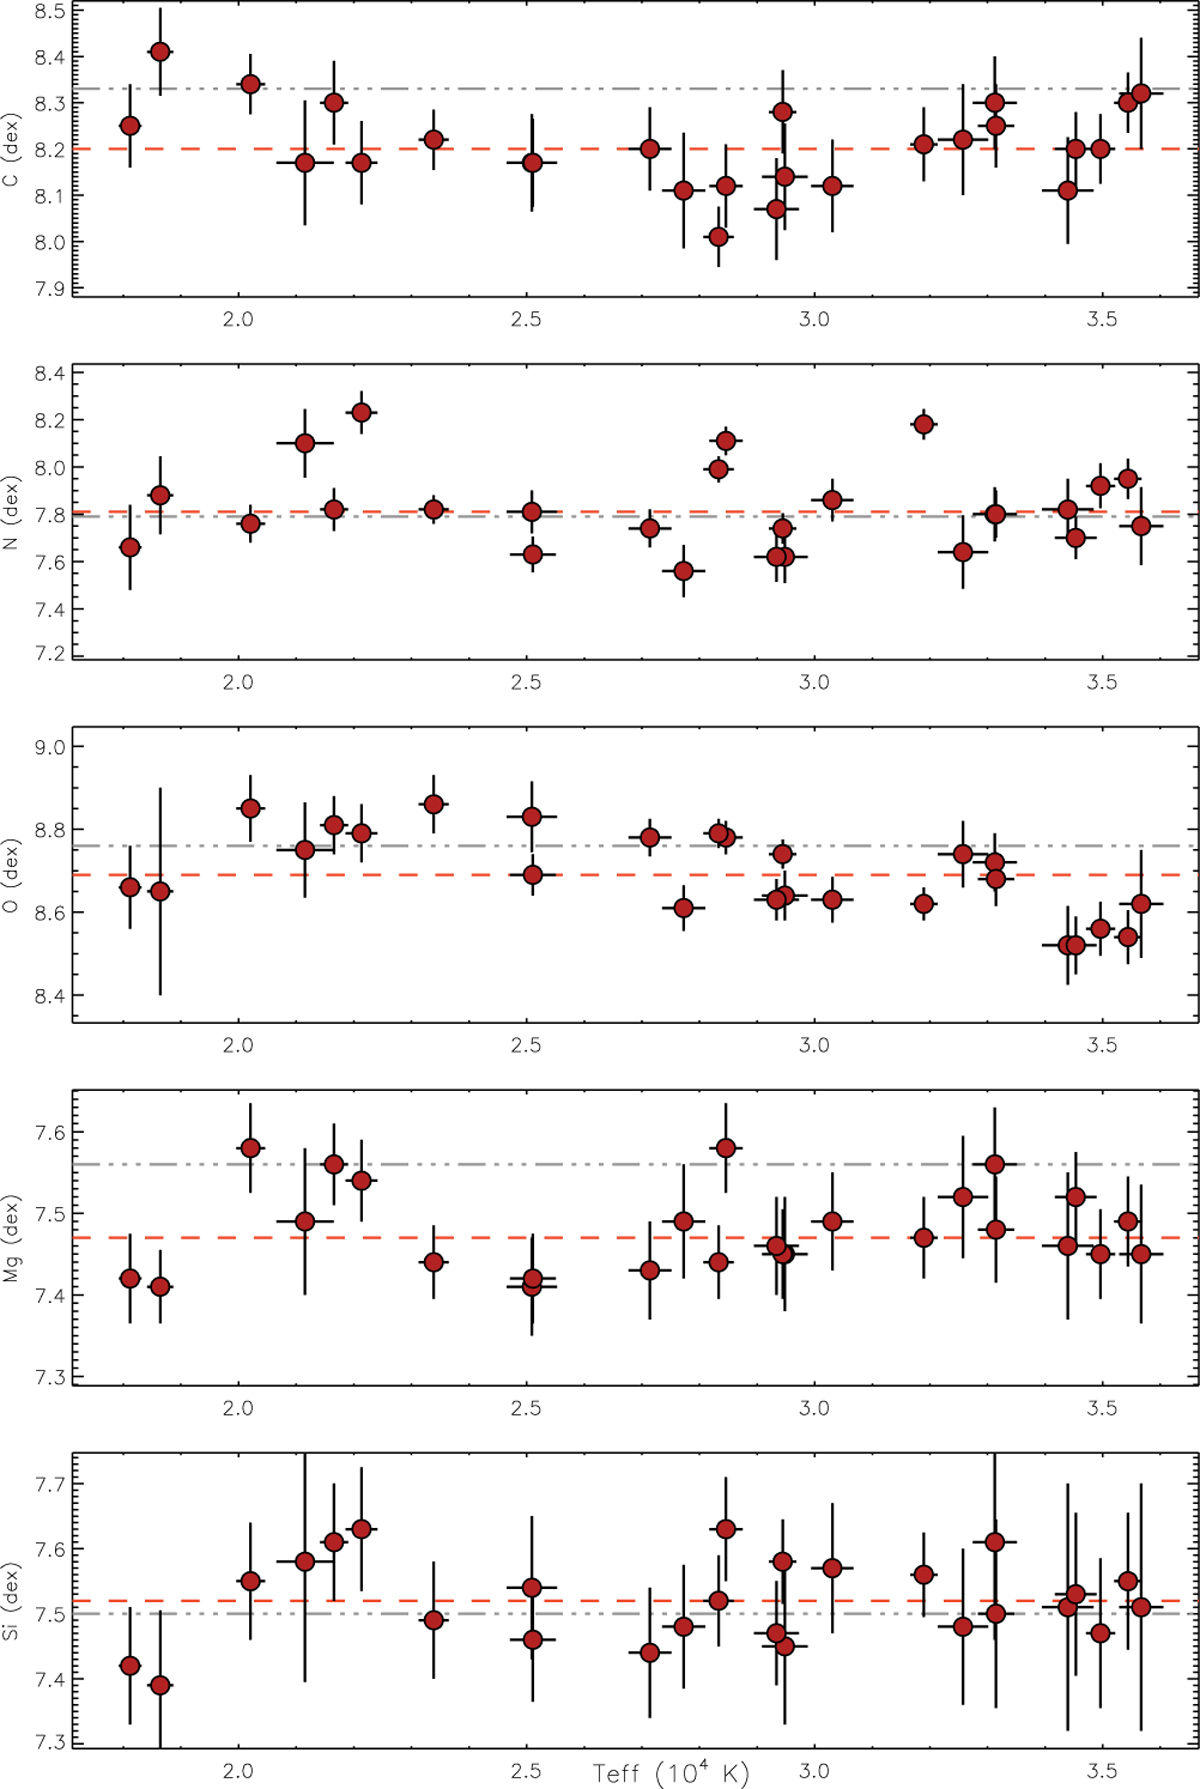
Trends of the derived metal abundances with effective temperature. Each panel shows the inferred abundances of C, N, O, Mg, and Si as a function of Teff for the analysed sample. The error bars correspond to the 68% credible intervals from the posterior distributions. A mild decrease in O abundance toward higher Teff is visible, consistent with the limitations of the current O II model atom at high ionisation stages (see text); no significant trends are found for the other elements. The dash-dotted line marks the CAS value, and the dashed line indicates the median of the derived abundances in each panel.
Current usage metrics show cumulative count of Article Views (full-text article views including HTML views, PDF and ePub downloads, according to the available data) and Abstracts Views on Vision4Press platform.
Data correspond to usage on the plateform after 2015. The current usage metrics is available 48-96 hours after online publication and is updated daily on week days.
Initial download of the metrics may take a while.