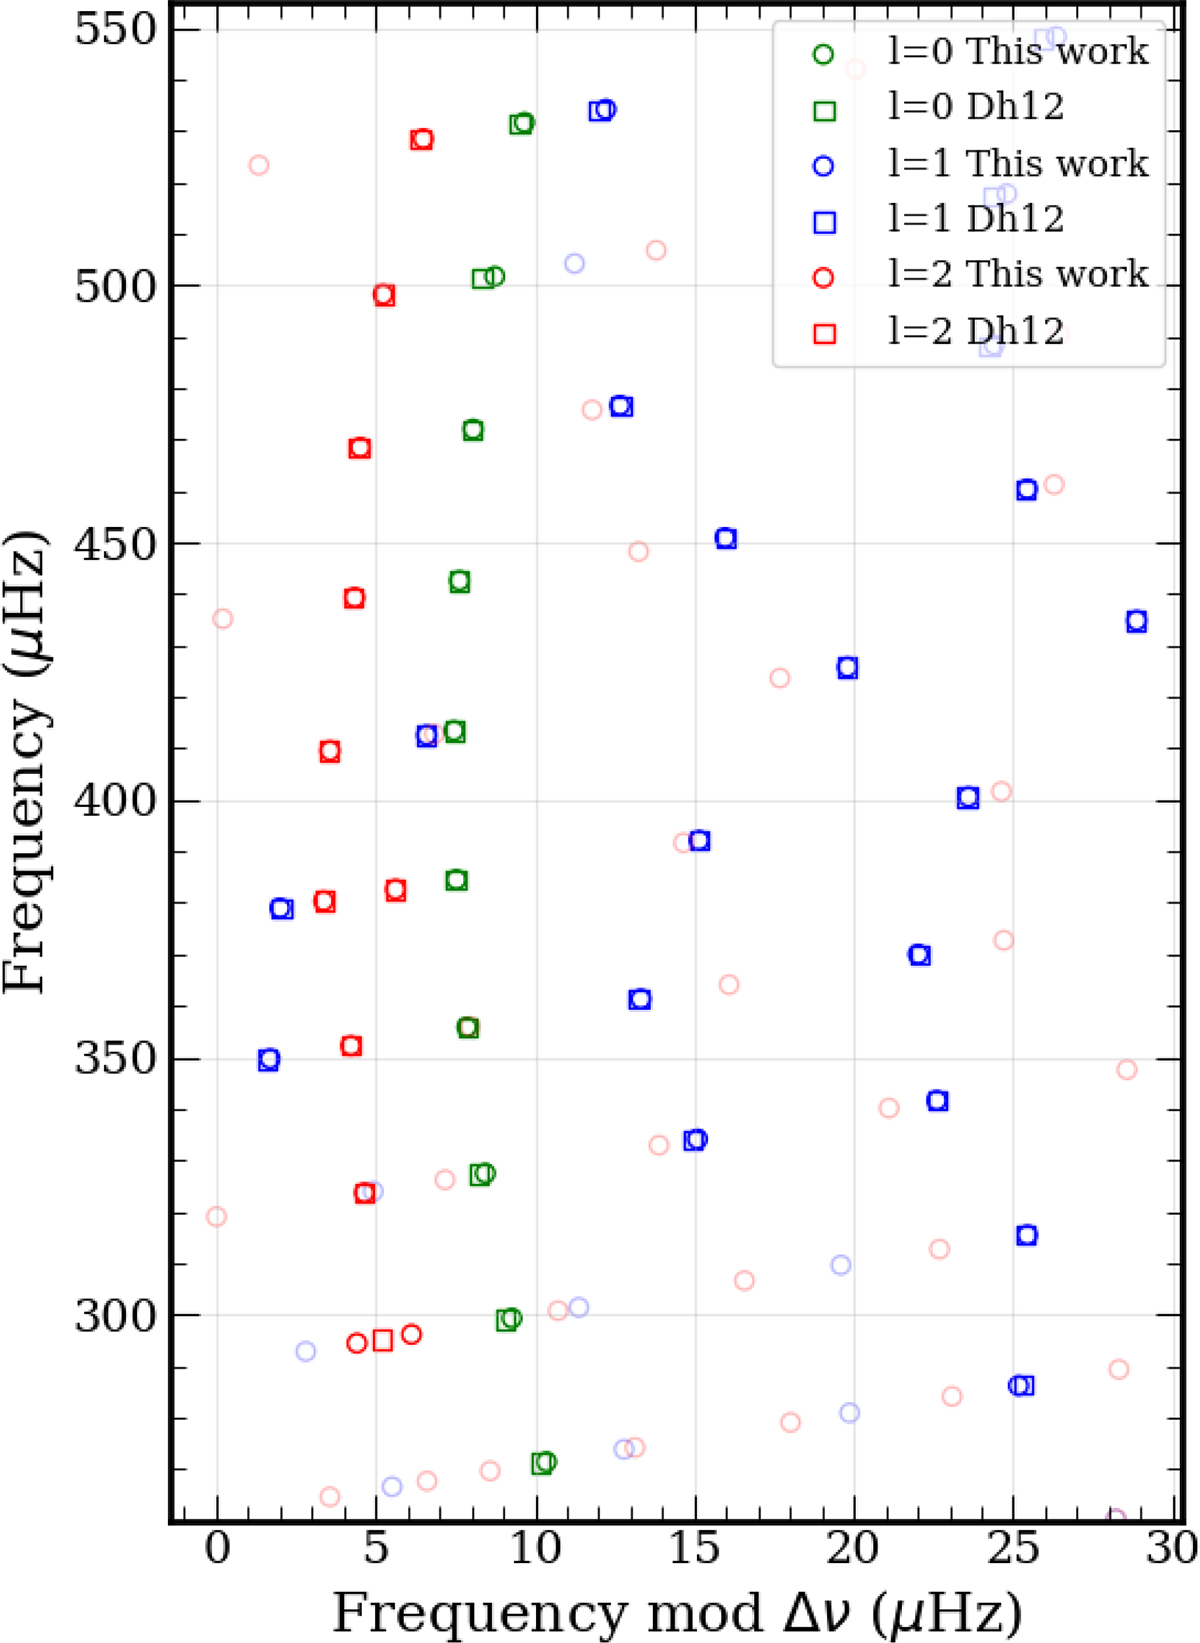
Fig. C.1.
Download original image
Echelle diagram comparing the oscillation frequencies derived from the Bayesian asymptotic model (circles, this work) with the peakbagged frequencies of KIC 7341231 (squares, Deheuvels et al. 2012, 2017, referred to as Dh12 in the legend of the figure). The markers for the model frequencies are rendered semi-transparent when the separation from a peakbagged frequency exceeds 1 μHz.
Current usage metrics show cumulative count of Article Views (full-text article views including HTML views, PDF and ePub downloads, according to the available data) and Abstracts Views on Vision4Press platform.
Data correspond to usage on the plateform after 2015. The current usage metrics is available 48-96 hours after online publication and is updated daily on week days.
Initial download of the metrics may take a while.