Open Access
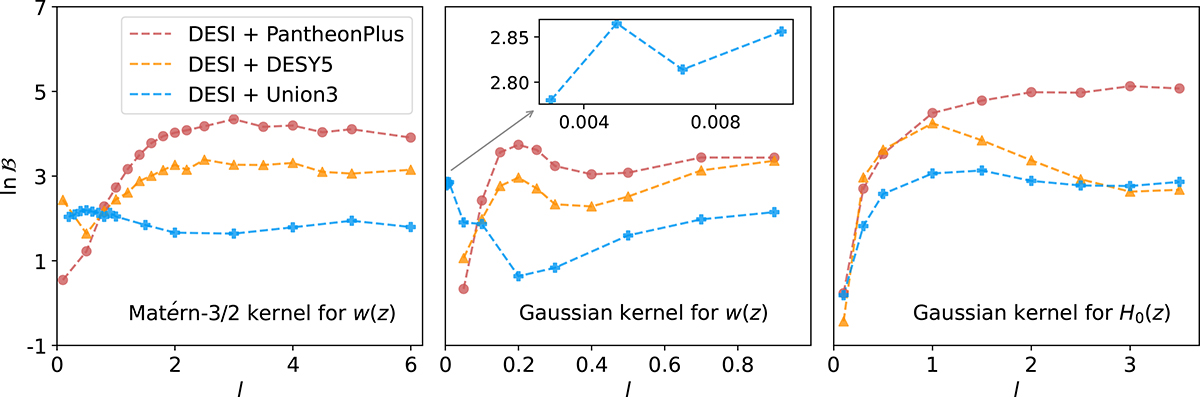
Fig. 4.
Download original image
Comparisons with different scale lengths under various prior assumptions. The red, orange, and blue scatters represent the Bayes factors relative to wCDM models using DESI combined with the PantheonPlus, DESY5, and Union3 datasets, respectively.
Current usage metrics show cumulative count of Article Views (full-text article views including HTML views, PDF and ePub downloads, according to the available data) and Abstracts Views on Vision4Press platform.
Data correspond to usage on the plateform after 2015. The current usage metrics is available 48-96 hours after online publication and is updated daily on week days.
Initial download of the metrics may take a while.