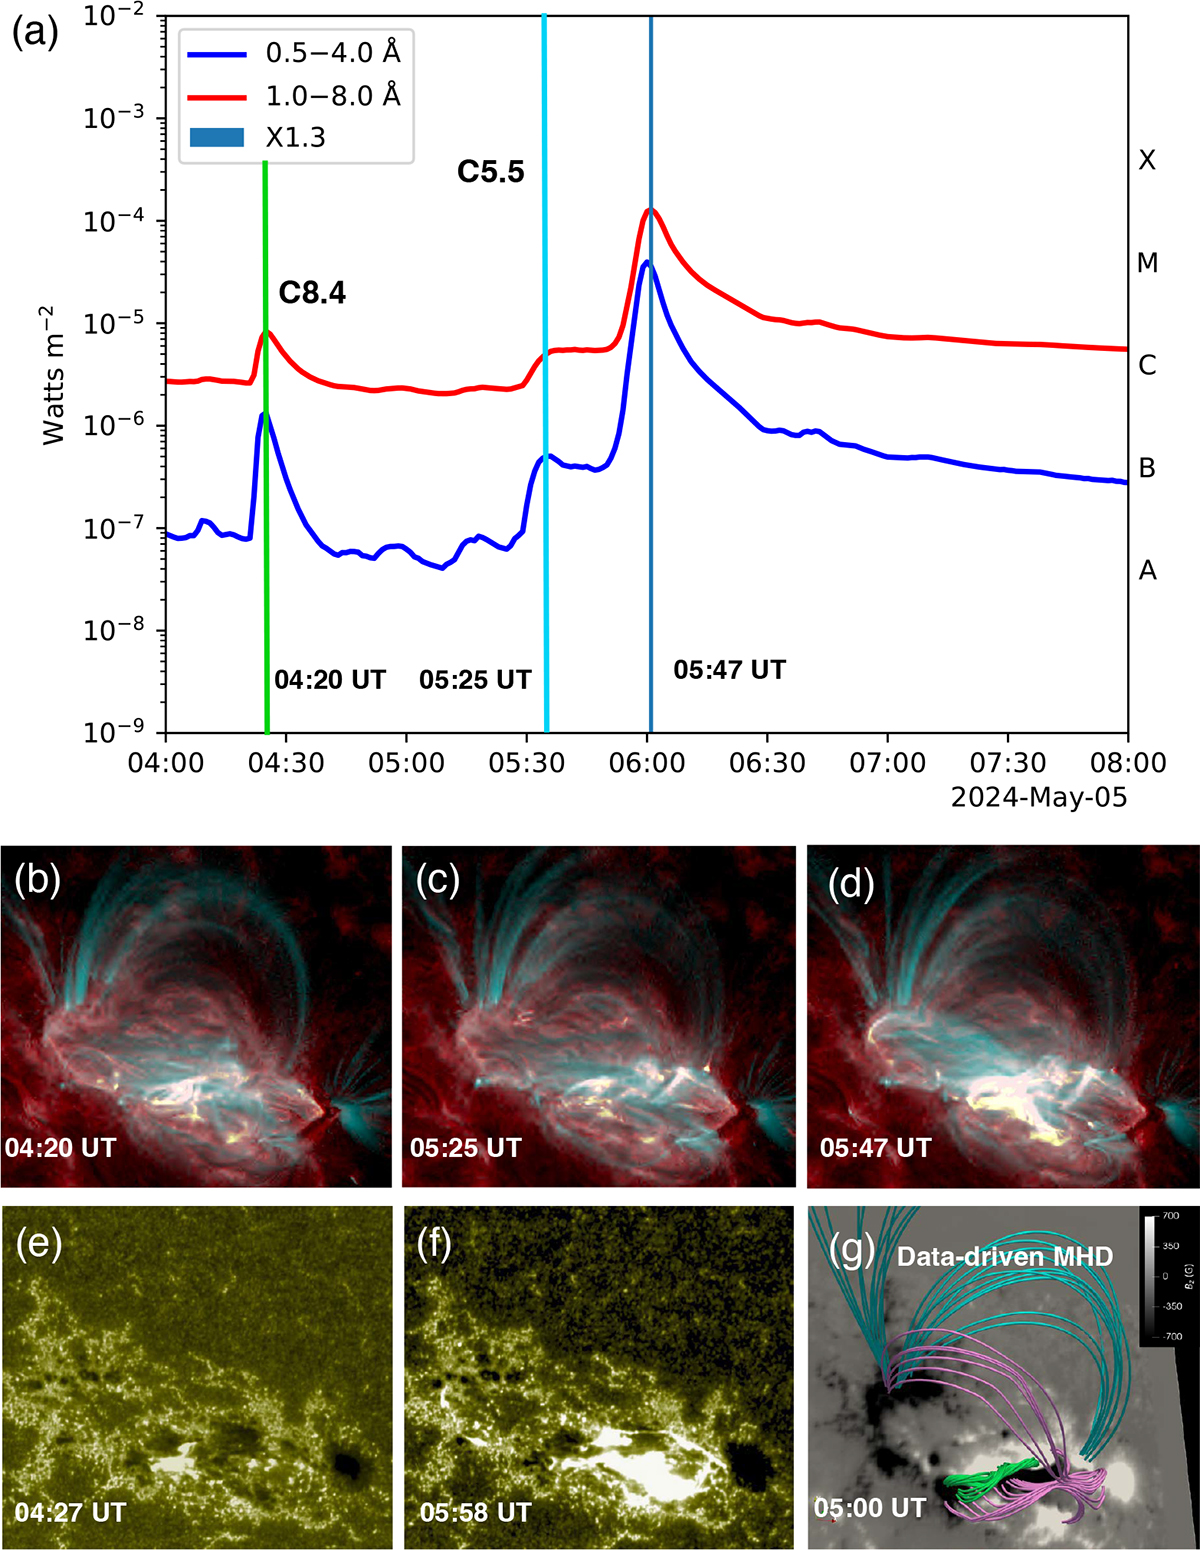
Fig. 1.
Download original image
Panel (a): Soft X-ray light curves (red: 1–8 Å; blue: 0.5–4 Å) from 04:00 to 08:00 UT on 2024 May 5. The vertical green, sky-blue, and dark blue lines mark the confined C8.4 and C5.5 flares and the eruptive X1.3 flare, respectively. Panels (b)–(d): Composite SDO/AIA 304 Å (red) and 131 Å (blue) images at the peak times of the three flares. Panels (e) and (f): 1600 Å flare-ribbon morphology of the first confined flare and the third eruptive flare, respectively. Panel (g): 3D magnetic field configuration from the data-driven MHD model at 05:00 UT. The green, pink, and cyan lines represent the flux rope, the fan–spine structure, and the surrounding coronal loops, respectively.
Current usage metrics show cumulative count of Article Views (full-text article views including HTML views, PDF and ePub downloads, according to the available data) and Abstracts Views on Vision4Press platform.
Data correspond to usage on the plateform after 2015. The current usage metrics is available 48-96 hours after online publication and is updated daily on week days.
Initial download of the metrics may take a while.