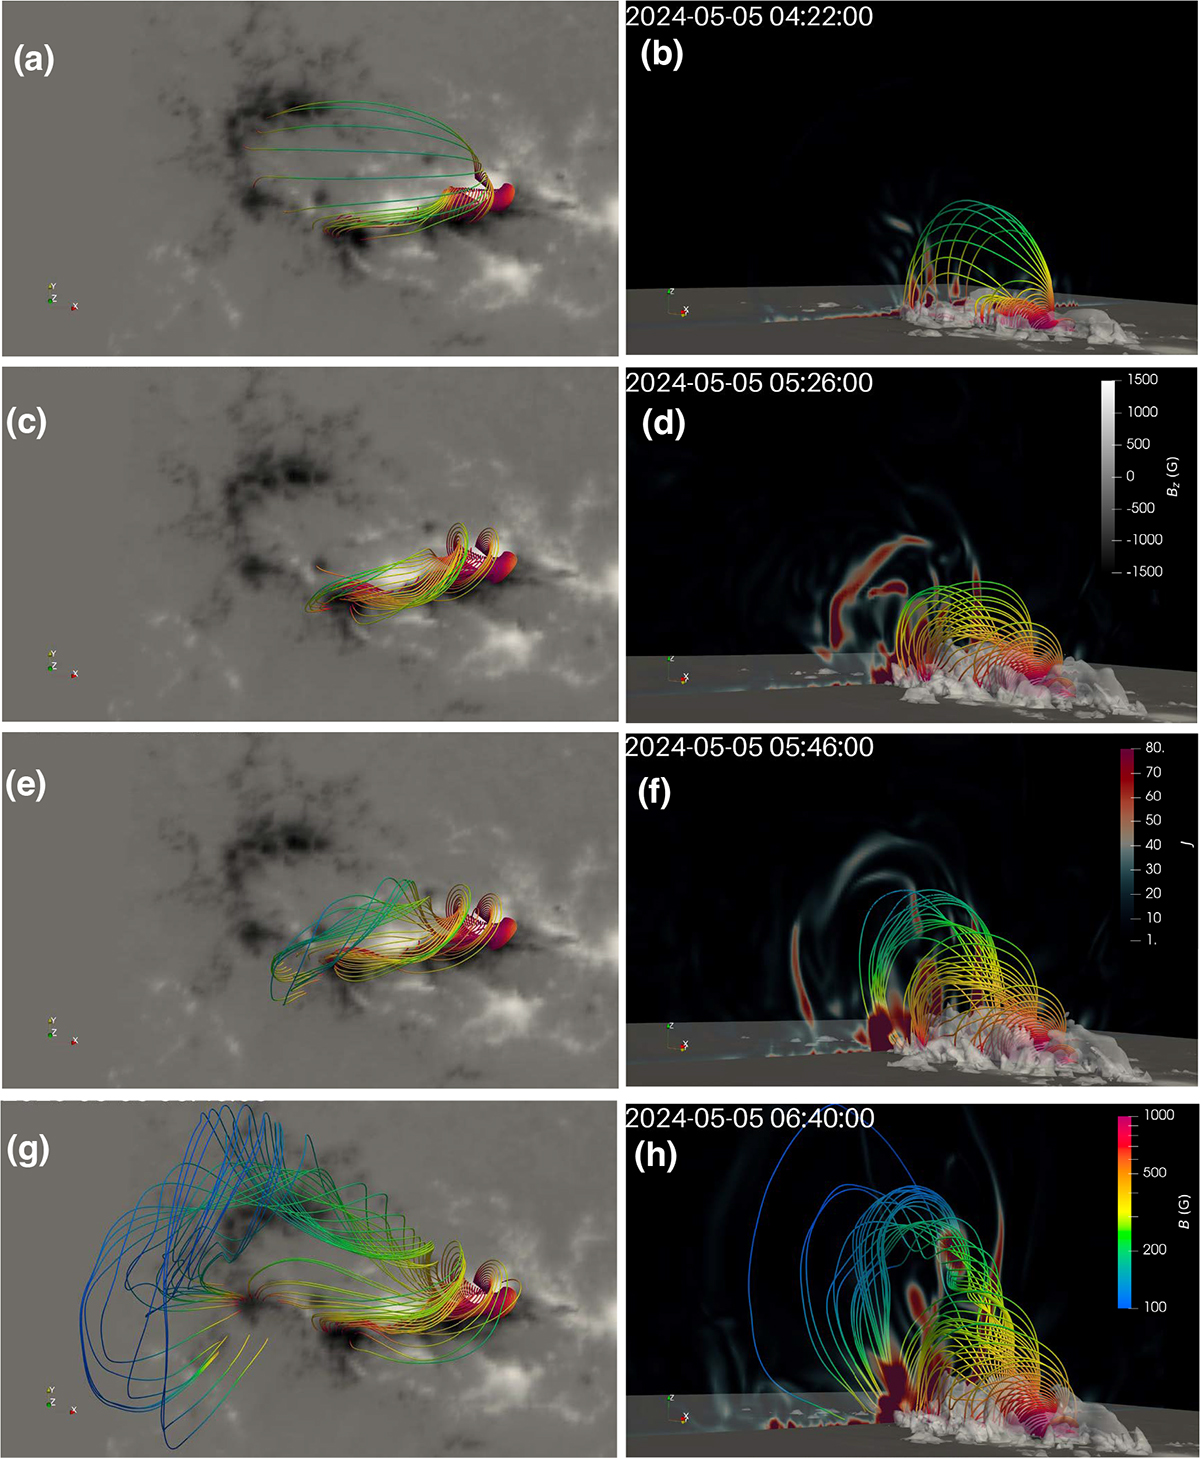
Fig. 2.
Download original image
Evolution of the 3D magnetic field lines in the simulation. The left and right panels show the top and side views, respectively. The field lines are color-coded by magnetic field strength. The side-plane slice displays the electric current density (J), and the gray contours highlight regions of enhanced current. An associated movie is available online.
Current usage metrics show cumulative count of Article Views (full-text article views including HTML views, PDF and ePub downloads, according to the available data) and Abstracts Views on Vision4Press platform.
Data correspond to usage on the plateform after 2015. The current usage metrics is available 48-96 hours after online publication and is updated daily on week days.
Initial download of the metrics may take a while.