Fig. 3.
Download original image
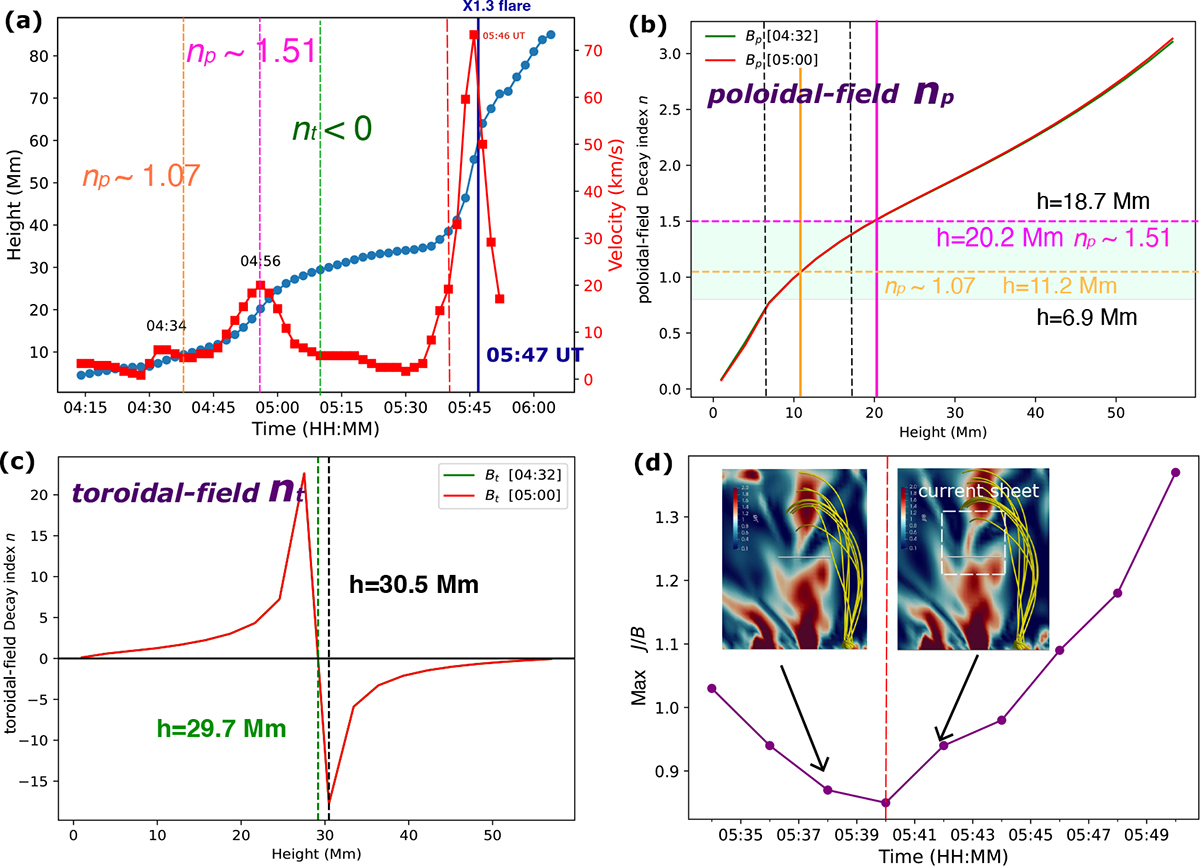
Panel (a): Kinematics of the eruptive structures. Blue and red dots and lines represent the apex height and the derived velocity, respectively. Panel (b): Distribution of the decay index computed from the By component (poloidal field). The cyan-shaded regions indicate the typical threshold for TI (n = 0.8–1.5). The green and red lines show the results derived from the potential field at 04:32 and 05:00 UT, respectively. The orange and pink lines mark the critical height and corresponding decay index at the onset (04:46 UT) and peak (04:56 UT) of the second acceleration phase. Panel (c): Decay-index distribution computed from the Bx component (toroidal field), with the vertical dashed green and black lines indicating the heights where the decay index equals zero and reaches its minimum, respectively. Panel (d): Evolution of the maximum J/B along the horizontal line in the inset J/B images. The vertical dashed red line indicates the time when the maximum J/B begins to increase.
Current usage metrics show cumulative count of Article Views (full-text article views including HTML views, PDF and ePub downloads, according to the available data) and Abstracts Views on Vision4Press platform.
Data correspond to usage on the plateform after 2015. The current usage metrics is available 48-96 hours after online publication and is updated daily on week days.
Initial download of the metrics may take a while.