Fig. E.1.
Download original image
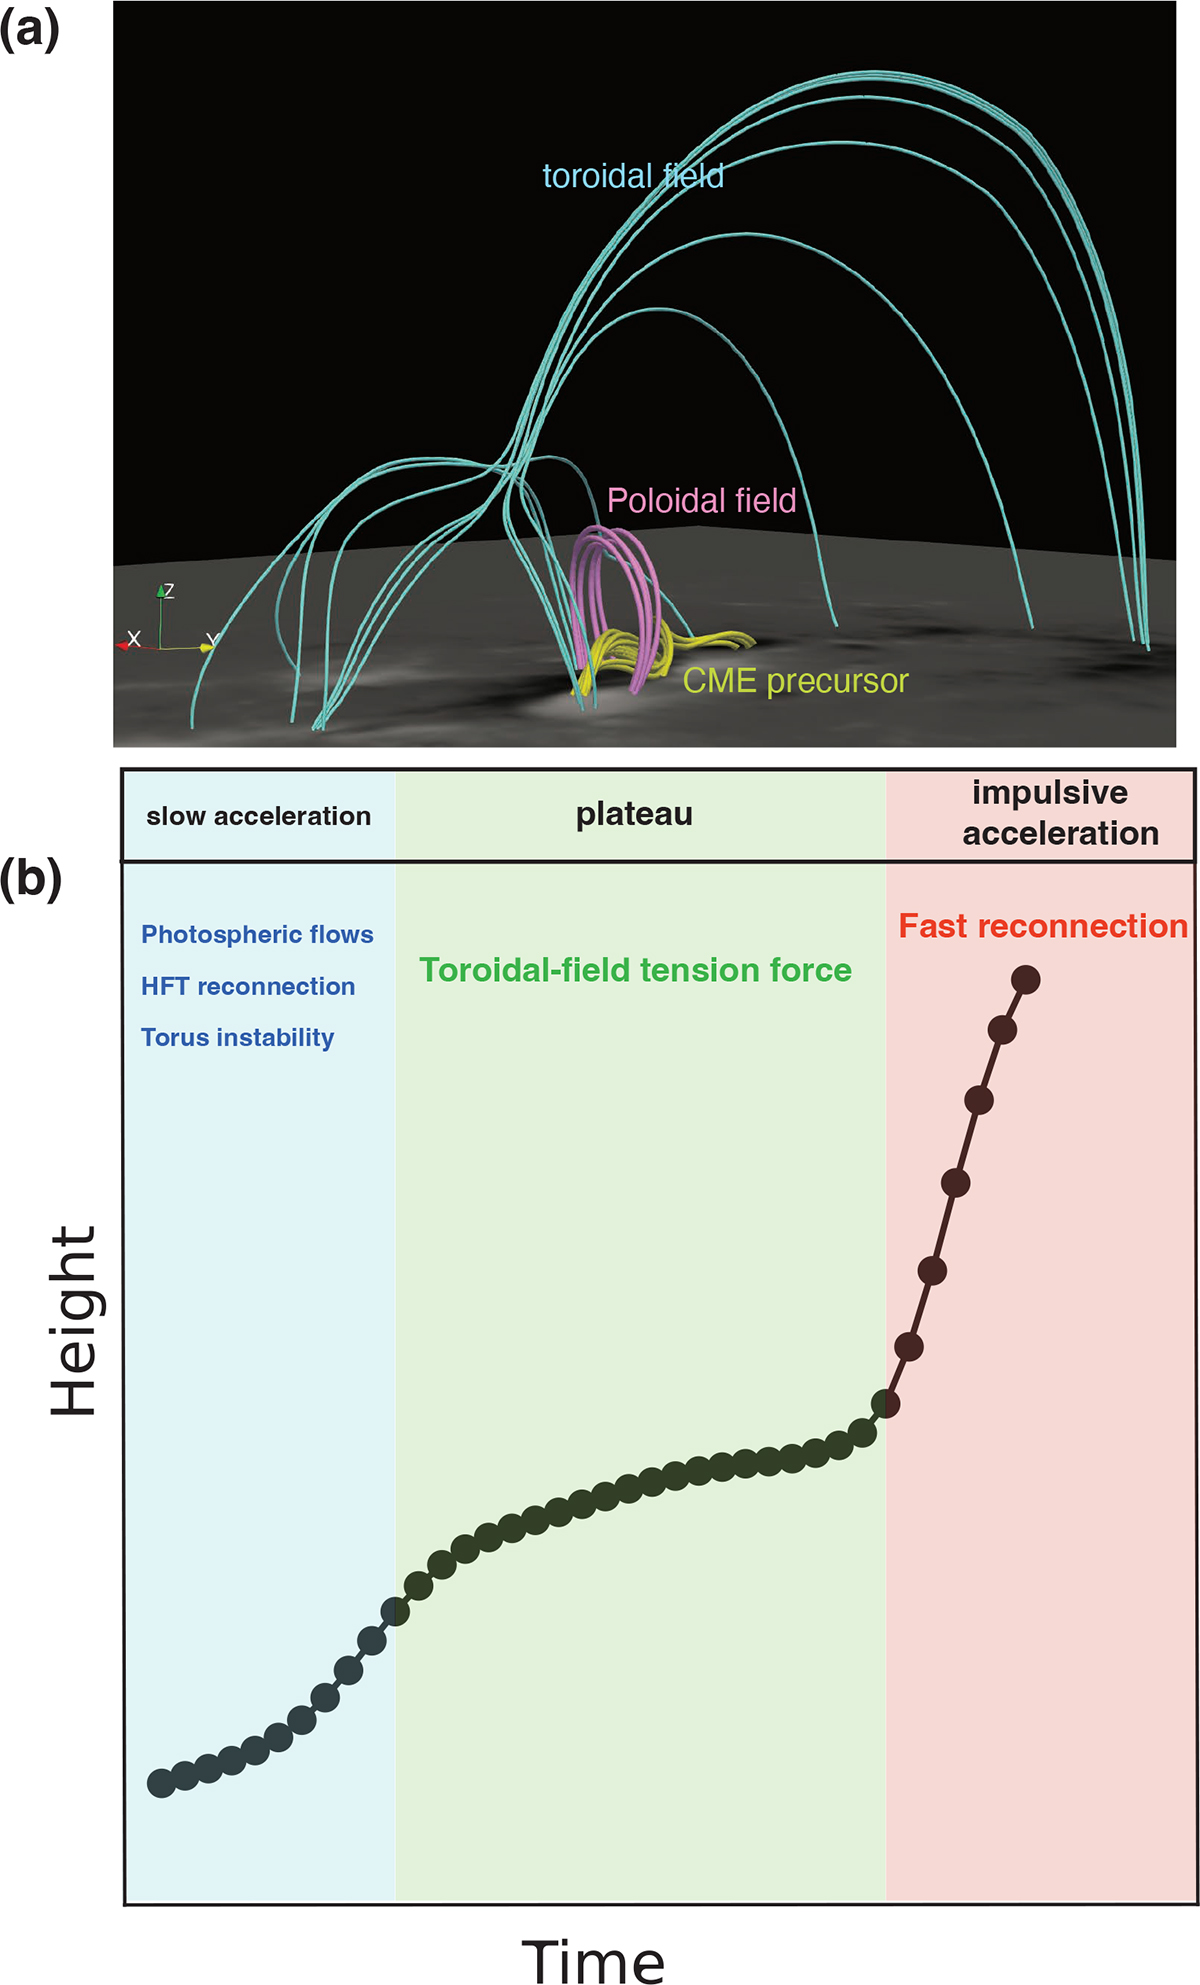
Magnetic configuration (a) and the corresponding kinematics of the CME precursors (b) during the initiation process. In panel (a), the yellow, pink, and cyan lines represent the CME precursor (flux rope), the overlying poloidal fields, and the toroidal fields associated with the fan–spine structure, respectively. In panel (b), the blue, yellow, and red bands indicate the three stages of the CME precursors. The black line with black dots shows the time–distance diagram of the CME precursors.
Current usage metrics show cumulative count of Article Views (full-text article views including HTML views, PDF and ePub downloads, according to the available data) and Abstracts Views on Vision4Press platform.
Data correspond to usage on the plateform after 2015. The current usage metrics is available 48-96 hours after online publication and is updated daily on week days.
Initial download of the metrics may take a while.