Fig. 4.
Download original image
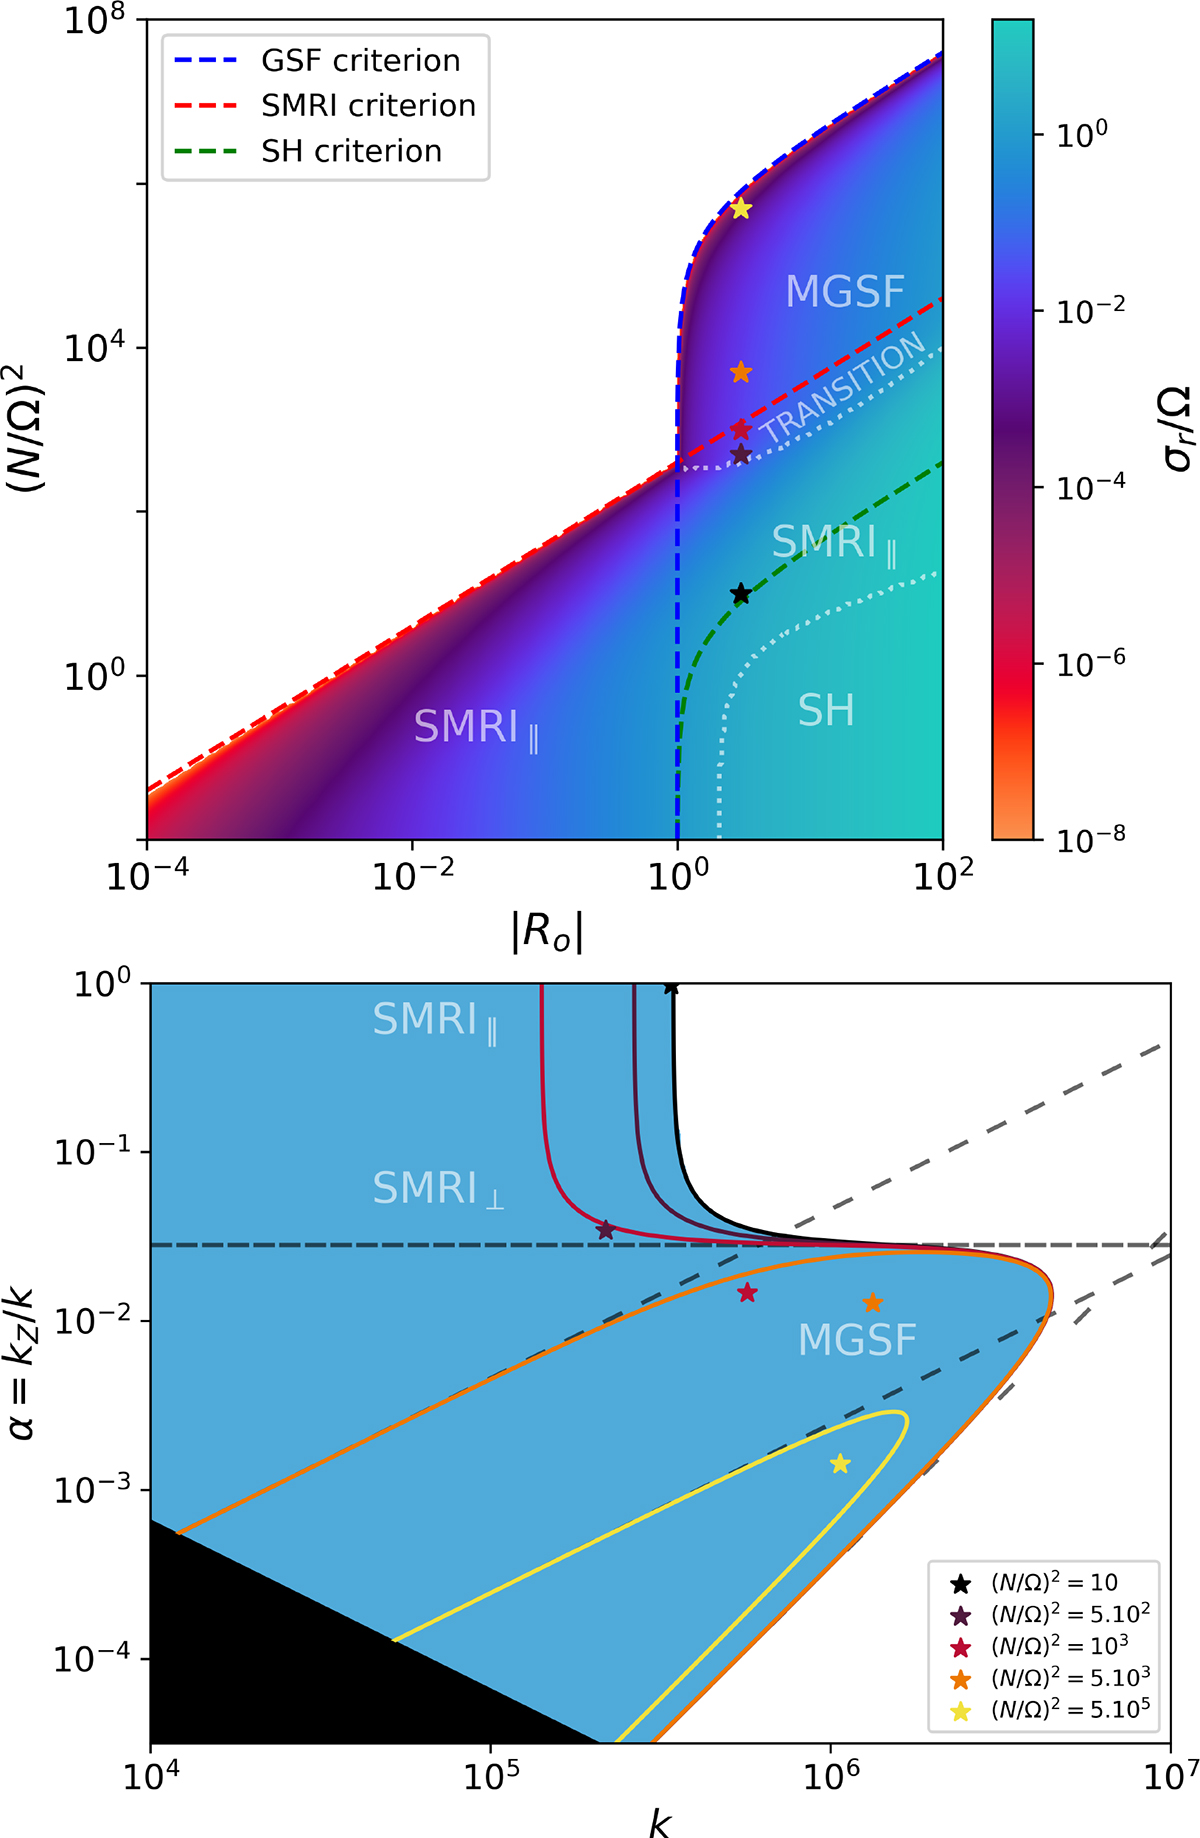
Top panel: Growth rate σr/Ω in the (|Ro|,(N/Ω)2) of the SMRI, GSF and SH instabilities, for a regime typical of radiative regions (see Table 1, ΛZ = 100, Λϕ = 0). The three dashed lines correspond to instability thresholds, red for SMRI (Eq. (9)), blue for GSF, green for SH. The dotted lines separate the dominant type of instability inside the unstable domain from the mode properties. Bottom Panel: Stability map in the (k, α) plane for a stellar regime with |Ro| = 3 and ΛZ = 100. Solid colored curves show the boundaries of the unstable domains for several values of the stratification parameter (N/Ω)2. The blue region corresponds to the unstable range for (N/Ω)2 = 10, and the star markers indicate, for each (N/Ω)2, the most unstable mode (corresponding to the regimes indicated by the stars in the top panel). The black region denotes modes excluded by our assumptions. The densely dashed horizontal line indicates the upper limit of the GSF-unstable domain set by magnetic stresses. The dashed lines show the modified stability boundaries due to the combined action of magnetic stresses and stratification, shown here for (N/Ω)2 = 5 × 10³ and 5 × 10⁵. The loosely dashed line marks the limit imposed by viscous diffusion. Labels indicate the domains of SMRI‖, SMRI⊥, and MGSF modes.
Current usage metrics show cumulative count of Article Views (full-text article views including HTML views, PDF and ePub downloads, according to the available data) and Abstracts Views on Vision4Press platform.
Data correspond to usage on the plateform after 2015. The current usage metrics is available 48-96 hours after online publication and is updated daily on week days.
Initial download of the metrics may take a while.