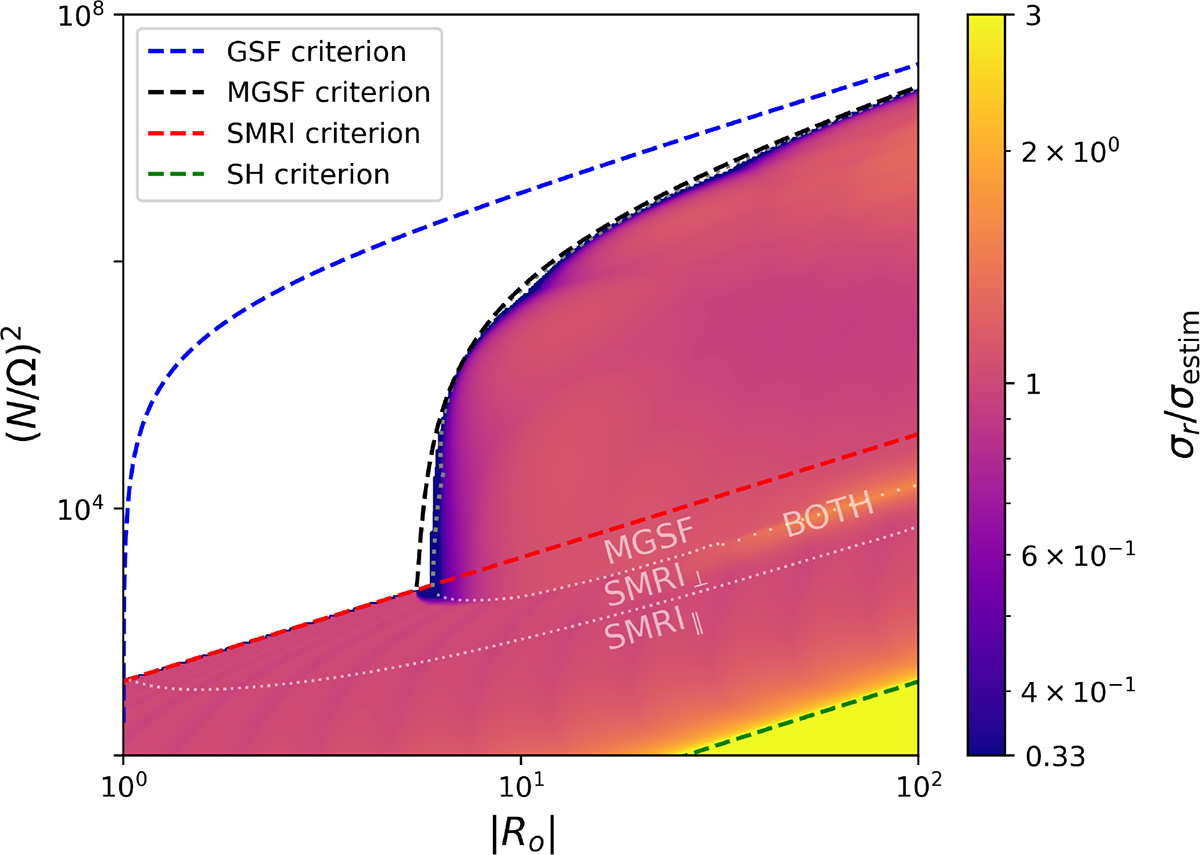
Fig. 5.
Download original image
Ratio of the growth rate σr to the analytical formula σestim ≡ max(σSMRI, σMGSF), which combines the predictions for SMRI (Eq. (11)) and MGSF (Eq. (17)). The flow parameters correspond to those of Fig. 4 (top panel), with ΛZ = 105. The white dotted lines delimit the different instability domains (see Appendix C and Fig. C.1 for details). The black dashed line indicate the sufficient MGSF stability criterion (Eq. (15)). The grey dotted line correspond to the combination of the necessary criteria (Eq. (C.12)). See Appendix C.3 for details.
Current usage metrics show cumulative count of Article Views (full-text article views including HTML views, PDF and ePub downloads, according to the available data) and Abstracts Views on Vision4Press platform.
Data correspond to usage on the plateform after 2015. The current usage metrics is available 48-96 hours after online publication and is updated daily on week days.
Initial download of the metrics may take a while.