Fig. 1.
Download original image
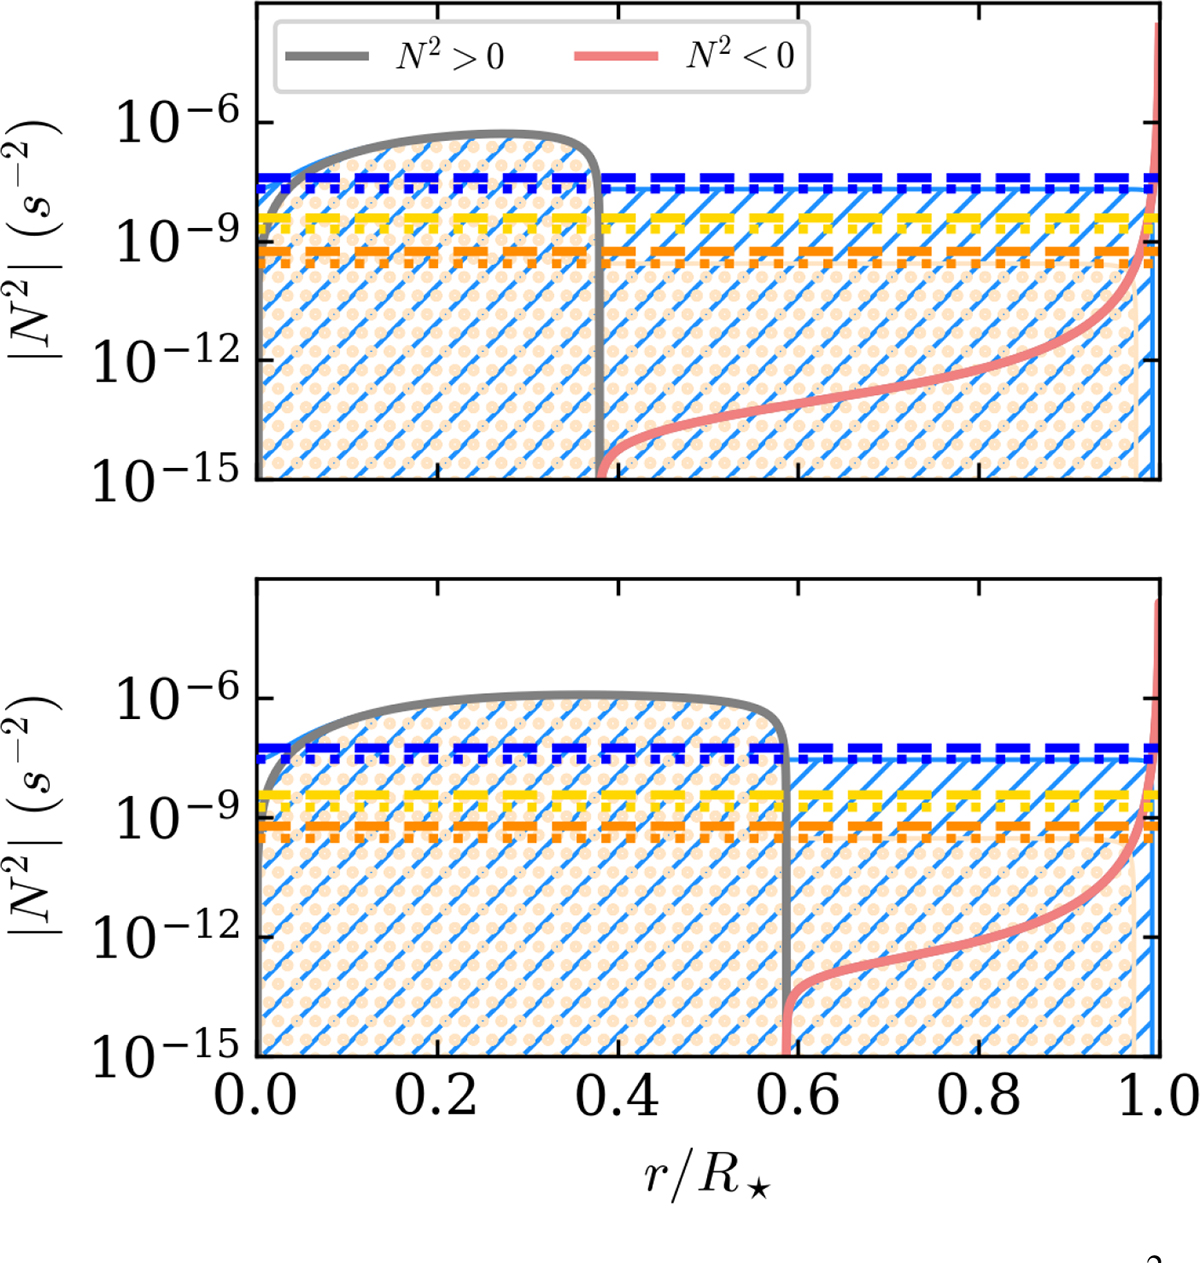
Modulus of the squared Brunt-Väisälä frequency, |N2|, for the 0.5 M⊙ model (top) and the 1 M⊙ model (bottom). Regions where N2 ≥ 0 are in gray, and regions where N2 < 0 are in red. The squared Coriolis frequency, 4Ω2, is indicated by the horizontal dashed line for the slow (orange), the intermediate (yellow), and the fast (blue) cases, while the horizontal dotted lines correspond to 2Ω2. The propagation region of gravito-inertial waves as a function of frequency is highlighted by the hatched areas (orange dots and blue hatches for the slow and fast cases, respectively).
Current usage metrics show cumulative count of Article Views (full-text article views including HTML views, PDF and ePub downloads, according to the available data) and Abstracts Views on Vision4Press platform.
Data correspond to usage on the plateform after 2015. The current usage metrics is available 48-96 hours after online publication and is updated daily on week days.
Initial download of the metrics may take a while.