Fig. 2.
Download original image
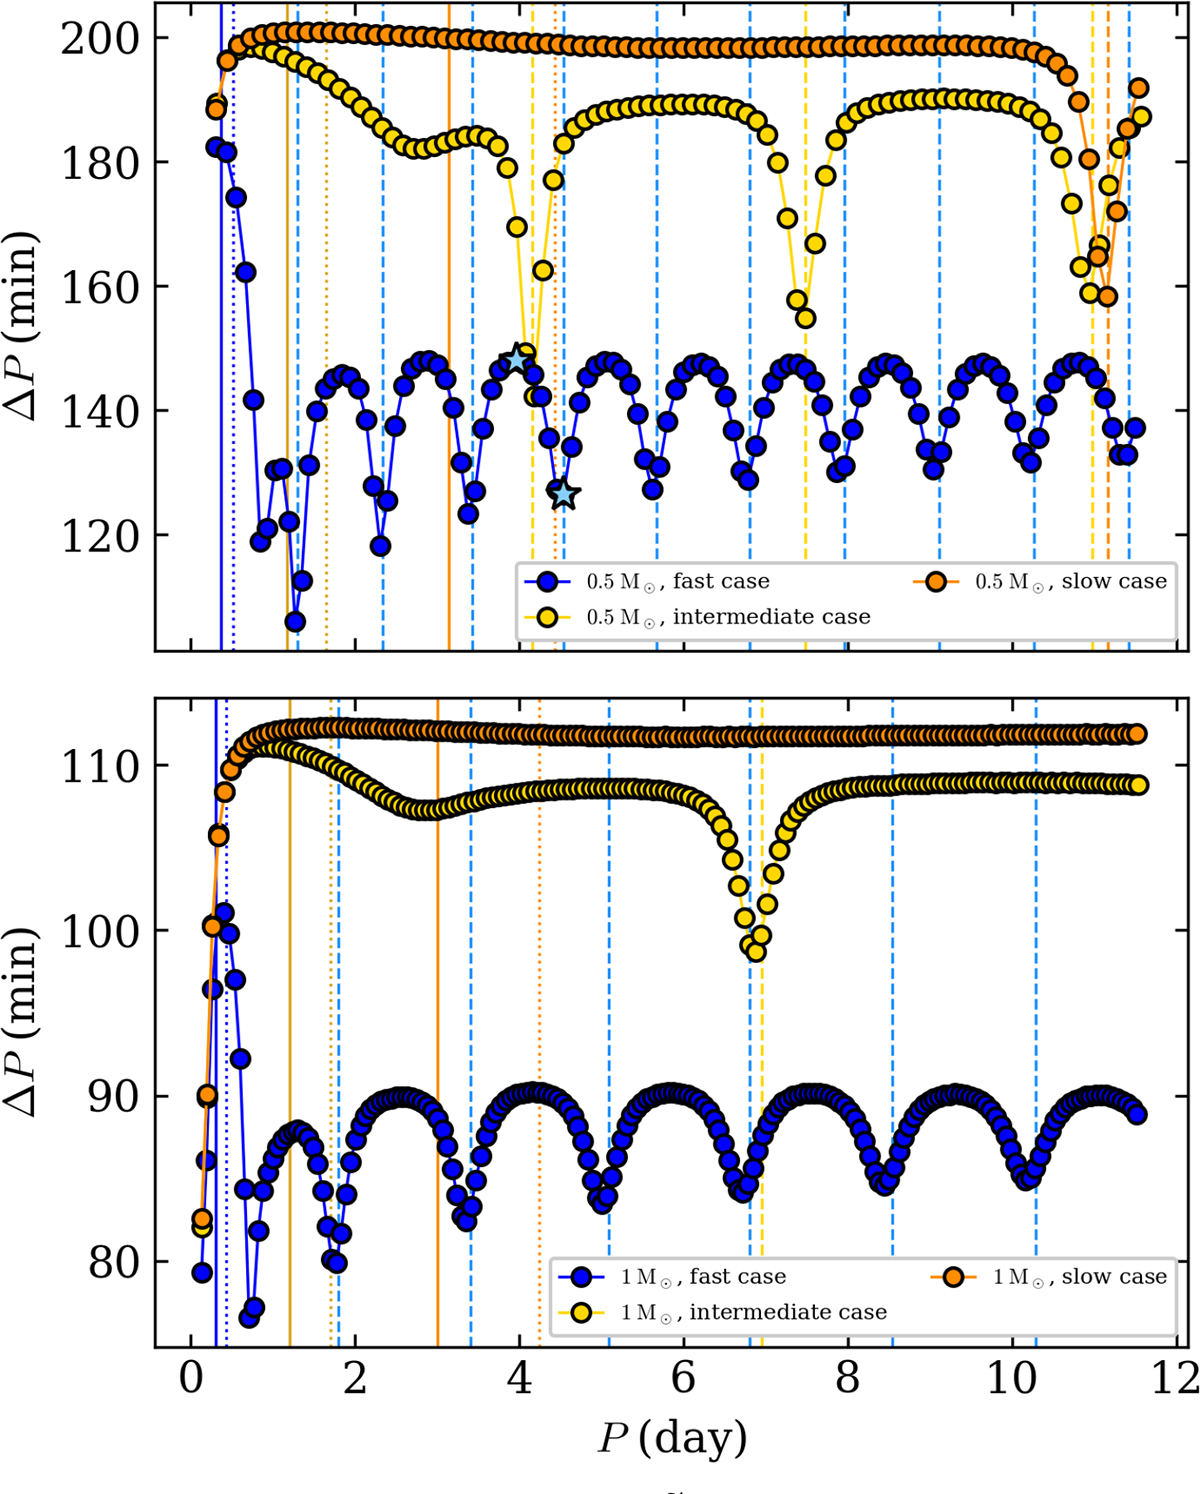
Top: ΔP vs P diagram for the ![]() modes in the 0.5 M⊙ model in the co-rotating frame. The dots correspond to the modes computed considering the full extent of the stellar structure, with the slow case in orange, the intermediate case in yellow, and the fast case in blue. The vertical dashed lines mark the period of the modes computed considering only the convective envelope. The position of the Coriolis frequency, 2Ω, is highlighted for the slow, the intermediate, and the fast cases (vertical thick lines in orange, yellow, and blue, respectively), while the
modes in the 0.5 M⊙ model in the co-rotating frame. The dots correspond to the modes computed considering the full extent of the stellar structure, with the slow case in orange, the intermediate case in yellow, and the fast case in blue. The vertical dashed lines mark the period of the modes computed considering only the convective envelope. The position of the Coriolis frequency, 2Ω, is highlighted for the slow, the intermediate, and the fast cases (vertical thick lines in orange, yellow, and blue, respectively), while the ![]() frequency is indicated with the vertical dotted lines. The location of the modes with the eigenfunctions represented in Fig. 3 is marked with the light blue stellar symbol. Bottom: Same as the top panel but for the 1 M⊙ model.
frequency is indicated with the vertical dotted lines. The location of the modes with the eigenfunctions represented in Fig. 3 is marked with the light blue stellar symbol. Bottom: Same as the top panel but for the 1 M⊙ model.
Current usage metrics show cumulative count of Article Views (full-text article views including HTML views, PDF and ePub downloads, according to the available data) and Abstracts Views on Vision4Press platform.
Data correspond to usage on the plateform after 2015. The current usage metrics is available 48-96 hours after online publication and is updated daily on week days.
Initial download of the metrics may take a while.