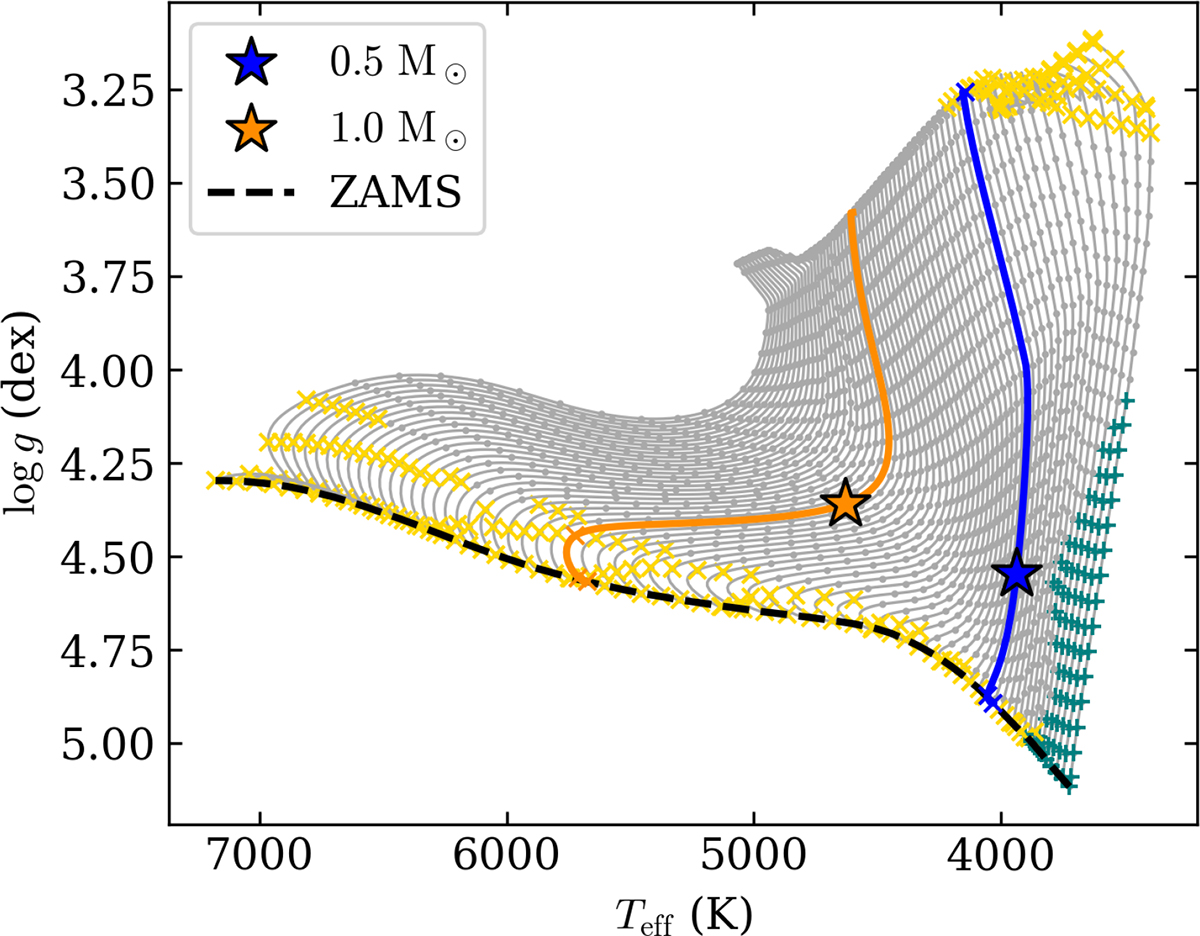
Fig. A.1.
Download original image
Evolutionary tracks for the stellar models (0.5 M⊙ in blue and 1 M⊙ in orange) considered in this work, from the end of the accreting phase to the ZAMS. The black thick lines shows the location of the ZAMS. The location on the track of the stellar models we consider in this work is highlighted by the star symbol. The other tracks of the Steindl et al. (2021) PMS grid ranging between M★ = 0.2 M⊙ and M★ = 1.5 M⊙ are shown in grey for comparison, with the structure model saved during the MESA run indicated by grey dots, yellow crosses, and teal plus signs. The crosses signal models which have a convective core while the plus signs correspond to stellar structure that are completely convective.
Current usage metrics show cumulative count of Article Views (full-text article views including HTML views, PDF and ePub downloads, according to the available data) and Abstracts Views on Vision4Press platform.
Data correspond to usage on the plateform after 2015. The current usage metrics is available 48-96 hours after online publication and is updated daily on week days.
Initial download of the metrics may take a while.