Fig. A.2.
Download original image
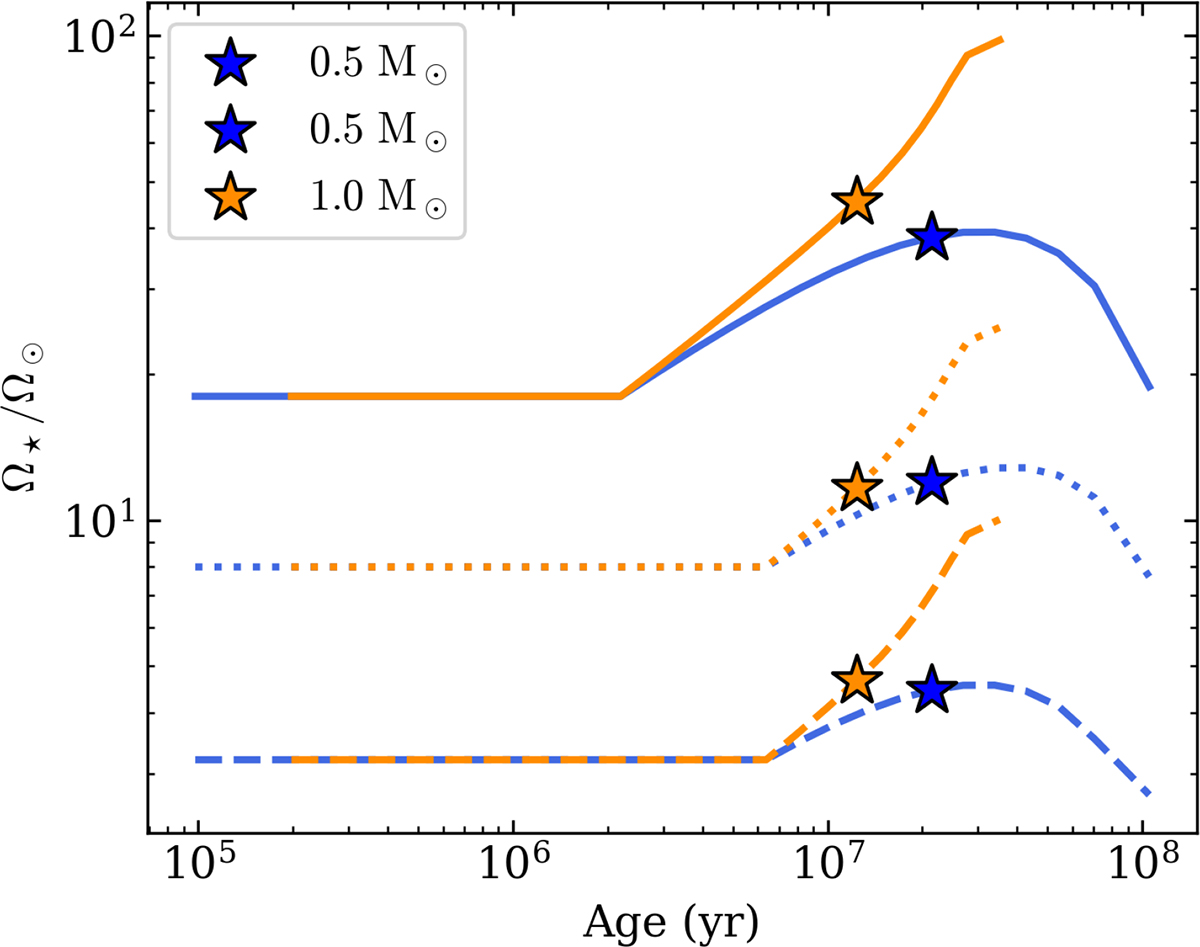
Rotational evolution computed for the 0.5 (blue) and 1 M⊙ (orange) models. The rotational track with slow initial condition is represented with a dashed line, the track with intermediate initial condition with a dotted line, and the track with fast initial condition with a thick line. The location of the stellar models we consider in this work is highlighted by the star symbol.
Current usage metrics show cumulative count of Article Views (full-text article views including HTML views, PDF and ePub downloads, according to the available data) and Abstracts Views on Vision4Press platform.
Data correspond to usage on the plateform after 2015. The current usage metrics is available 48-96 hours after online publication and is updated daily on week days.
Initial download of the metrics may take a while.