| Issue |
A&A
Volume 707, March 2026
|
|
|---|---|---|
| Article Number | C3 | |
| Number of page(s) | 5 | |
| Section | Interstellar and circumstellar matter | |
| DOI | https://doi.org/10.1051/0004-6361/202659479e | |
| Published online | 13 March 2026 | |
Investigating chemical variations between interstellar gas clouds in the solar neighbourhood (Corrigendum)
1
Department of Astronomy, University of Geneva,
Chemin Pegasi 51,
Versoix,
Switzerland
2
European Southern Observatory,
Karl-Schwarzschild-Str. 2,
85748
Garching,
Germany
3
Université Claude Bernard Lyon 1, Centre de Recherche Astrophysique de Lyon UMR5574,
9 Av. Charles André,
69230
Saint-Genis-Laval,
France
4
French-Chilean Laboratory for Astronomy (FCLA), CNRS-IRL3386, U. de Chile,
Camino el Observatorio 1515, Casilla 36-D,
Santiago,
Chile
5
European Southern Observatory,
Alonso de Córdova 3107, Vitacura, Casilla
19001,
Santiago,
Chile
6
Department of Astrophysical Sciences, Princeton University,
Princeton,
NJ
08544-1001,
USA
7
AURA for ESA, Space Telescope Science Institute,
3700 San Martin Drive,
Baltimore,
MD
21218,
USA
8
Department of Physics & Astronomy, Johns Hopkins University,
3400 N. Charles Street,
Baltimore,
MD
21218,
USA
9
Institute of Astronomy, Kharkiv National University,
4 Svobody Sq.,
Kharkiv
61022,
Ukraine
★ Corresponding author: This email address is being protected from spambots. You need JavaScript enabled to view it.
Key words: Galaxy: abundances / Galaxy: general / local insterstellar matter / solar neighborhood / errata, addenda
We have identified a mistake in the calculation of the total hydrogen column densities for all eight lines of sight in this sample. In the text of the paper, we report the total hydrogen as N(Htot) = N(H I) + × N(H2). However, it should be N(Htot) = N(H I) +2N(H2), with the factor of 2 on N(H2). The effect of this is a slight decrease in metallicities, both for the full line-of-sight measurements, [M/H]tot, [M/H]ref, and [M/H]vol, and the simulations of metallicities of individual gas clouds, [M/H]i. The only unaffected line of sight is that towards θ1 Ori C because it has a negligible contribution from H2. The methodology of the paper remains unaffected, as do all measurements of dust depletion, for both the full line of sight, [Zn/Fe]fit,tot, and individual (groups of) components, [Zn/Fe]fit,i. The levels of variations in the metallicities from the simulations also do not change. Therefore, the overall conclusions of the paper remain valid. We still constrain the same metallicities, but these values are slightly lower than presented in the paper. In summary, the consequences are the following:
The total metallicities along full lines of sight are generally lower, with changes between 0.08 and 0.16 dex, or 17% and 31%.
This decreases the values of the simulated metallicities by the same margin.
This increases the number of ‘most-likely’ realisations because there are many more realisations with all metallicities <0.5 dex.
This broadens the gas fraction ranges for all ‘most-likely’ realisations.
In Table 1, we show the updated values and quantify the differences, in terms of both a percentage and dex increase. We reproduce Tables 5, 6, 7, and 8 from the paper for the impacted lines of sight in Tables 2, 3, 5, and 4, respectively. In Appendices A and B, we include the updated figures for the abundance patterns and simulated metallicities, respectively. In Appendix C we include the comparison-to-literature plot with the updated metallicity values for the full lines of sight.
We have also noticed that Fig. 7 in the original paper, which shows the realisations of the most-likely metallicities for the line of sight towards θ1 Ori C, is not accurate. Figure 1 here is the corrected version.
Appendix A Updated abundance pattern figures
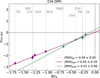 |
Fig. A.1 Updated abundance pattern for χ Oph. |
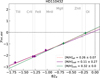 |
Fig. A.2 Updated abundance pattern for HD 110432. |
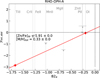 |
Fig. A.3 Updated abundance pattern for ρ Oph A. |
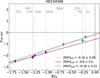 |
Fig. A.4 Updated abundance pattern for HD 154368. |
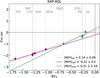 |
Fig. A.5 Updated abundance pattern for κ Aql. |
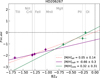 |
Fig. A.6 Updated abundance pattern for HD 206267. |
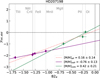 |
Fig. A.7 Updated abundance pattern for HD 207198. |
Appendix B Updated simulated metallicity figures
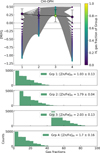 |
Fig. B.1 Updated simulated metallicities for χ Oph. |
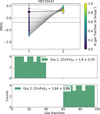 |
Fig. B.2 Updated simulated metallicities for HD 110432. |
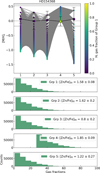 |
Fig. B.3 Updated simulated metallicities for HD 154368. |
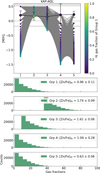 |
Fig. B.4 Updated simulated metallicities for κ Aql. |
Appendix C Updated comparison-to-literature plot
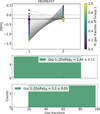 |
Fig. B.5 Updated simulated metallicities for HD 206267. |
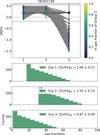 |
Fig. B.6 Updated simulated metallicities for HD 207198. |
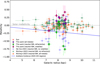 |
Fig. C.1 Updated comparison-to-literature plot for full lines of sight. |
© The Authors 2026
 Open Access article, published by EDP Sciences, under the terms of the Creative Commons Attribution License (https://creativecommons.org/licenses/by/4.0), which permits unrestricted use, distribution, and reproduction in any medium, provided the original work is properly cited.
This article is published in open access under the Subscribe to Open model. This email address is being protected from spambots. You need JavaScript enabled to view it. to support open access publication.
All Tables
Five sight lines where the component with the highest depletion also contains the majority of the hydrogen gas.
Metallicities and corresponding gas fractions for the cases with the minimum difference in metallicity.
Minimum and maximum metallicities and their respective z-test significance for the minimum-difference realisation.
Results from the abundance patterns for each target along the full line of sight.
All Figures
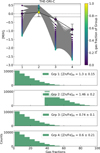 |
Fig. 1 Corrected version of Fig. 6 from the original paper. |
| In the text | |
|
Fig. A.1 Updated abundance pattern for χ Oph. |
| In the text | |
|
Fig. A.2 Updated abundance pattern for HD 110432. |
| In the text | |
|
Fig. A.3 Updated abundance pattern for ρ Oph A. |
| In the text | |
|
Fig. A.4 Updated abundance pattern for HD 154368. |
| In the text | |
|
Fig. A.5 Updated abundance pattern for κ Aql. |
| In the text | |
|
Fig. A.6 Updated abundance pattern for HD 206267. |
| In the text | |
|
Fig. A.7 Updated abundance pattern for HD 207198. |
| In the text | |
|
Fig. B.1 Updated simulated metallicities for χ Oph. |
| In the text | |
|
Fig. B.2 Updated simulated metallicities for HD 110432. |
| In the text | |
|
Fig. B.3 Updated simulated metallicities for HD 154368. |
| In the text | |
|
Fig. B.4 Updated simulated metallicities for κ Aql. |
| In the text | |
|
Fig. B.5 Updated simulated metallicities for HD 206267. |
| In the text | |
|
Fig. B.6 Updated simulated metallicities for HD 207198. |
| In the text | |
|
Fig. C.1 Updated comparison-to-literature plot for full lines of sight. |
| In the text | |
Current usage metrics show cumulative count of Article Views (full-text article views including HTML views, PDF and ePub downloads, according to the available data) and Abstracts Views on Vision4Press platform.
Data correspond to usage on the plateform after 2015. The current usage metrics is available 48-96 hours after online publication and is updated daily on week days.
Initial download of the metrics may take a while.