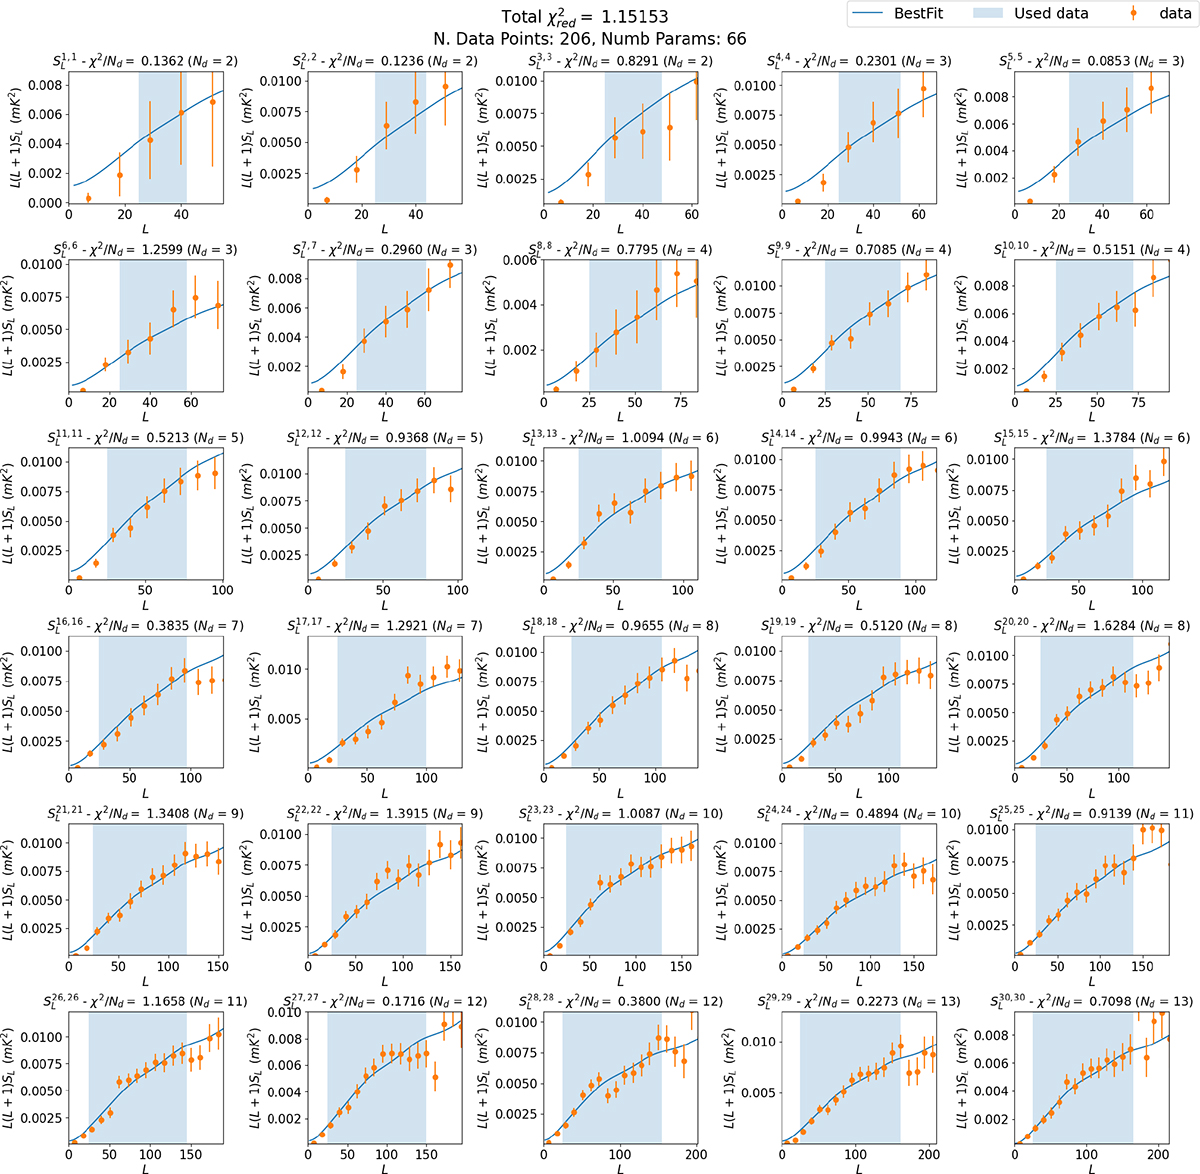
Fig. 11.
Download original image
Comparison of best-fit theoretical and simulated angular power spectra for BINGO frequency channels. The blue solid curve shows the best-fit theoretical angular power spectrum (SL) derived from the optimal cosmological and hydrogen intensity (HI) parameters. Orange points represent simulated BINGO data, including contributions from white noise and foreground removal. Error bars indicate the 1σ uncertainty on SL, computed as the standard deviation across 3000 mock realizations. For each frequency channel, the number of data points (Nd) and the reduced χ2 statistic (χ2/Nd) are provided to quantify the agreement between theory and simulation.
Current usage metrics show cumulative count of Article Views (full-text article views including HTML views, PDF and ePub downloads, according to the available data) and Abstracts Views on Vision4Press platform.
Data correspond to usage on the plateform after 2015. The current usage metrics is available 48-96 hours after online publication and is updated daily on week days.
Initial download of the metrics may take a while.