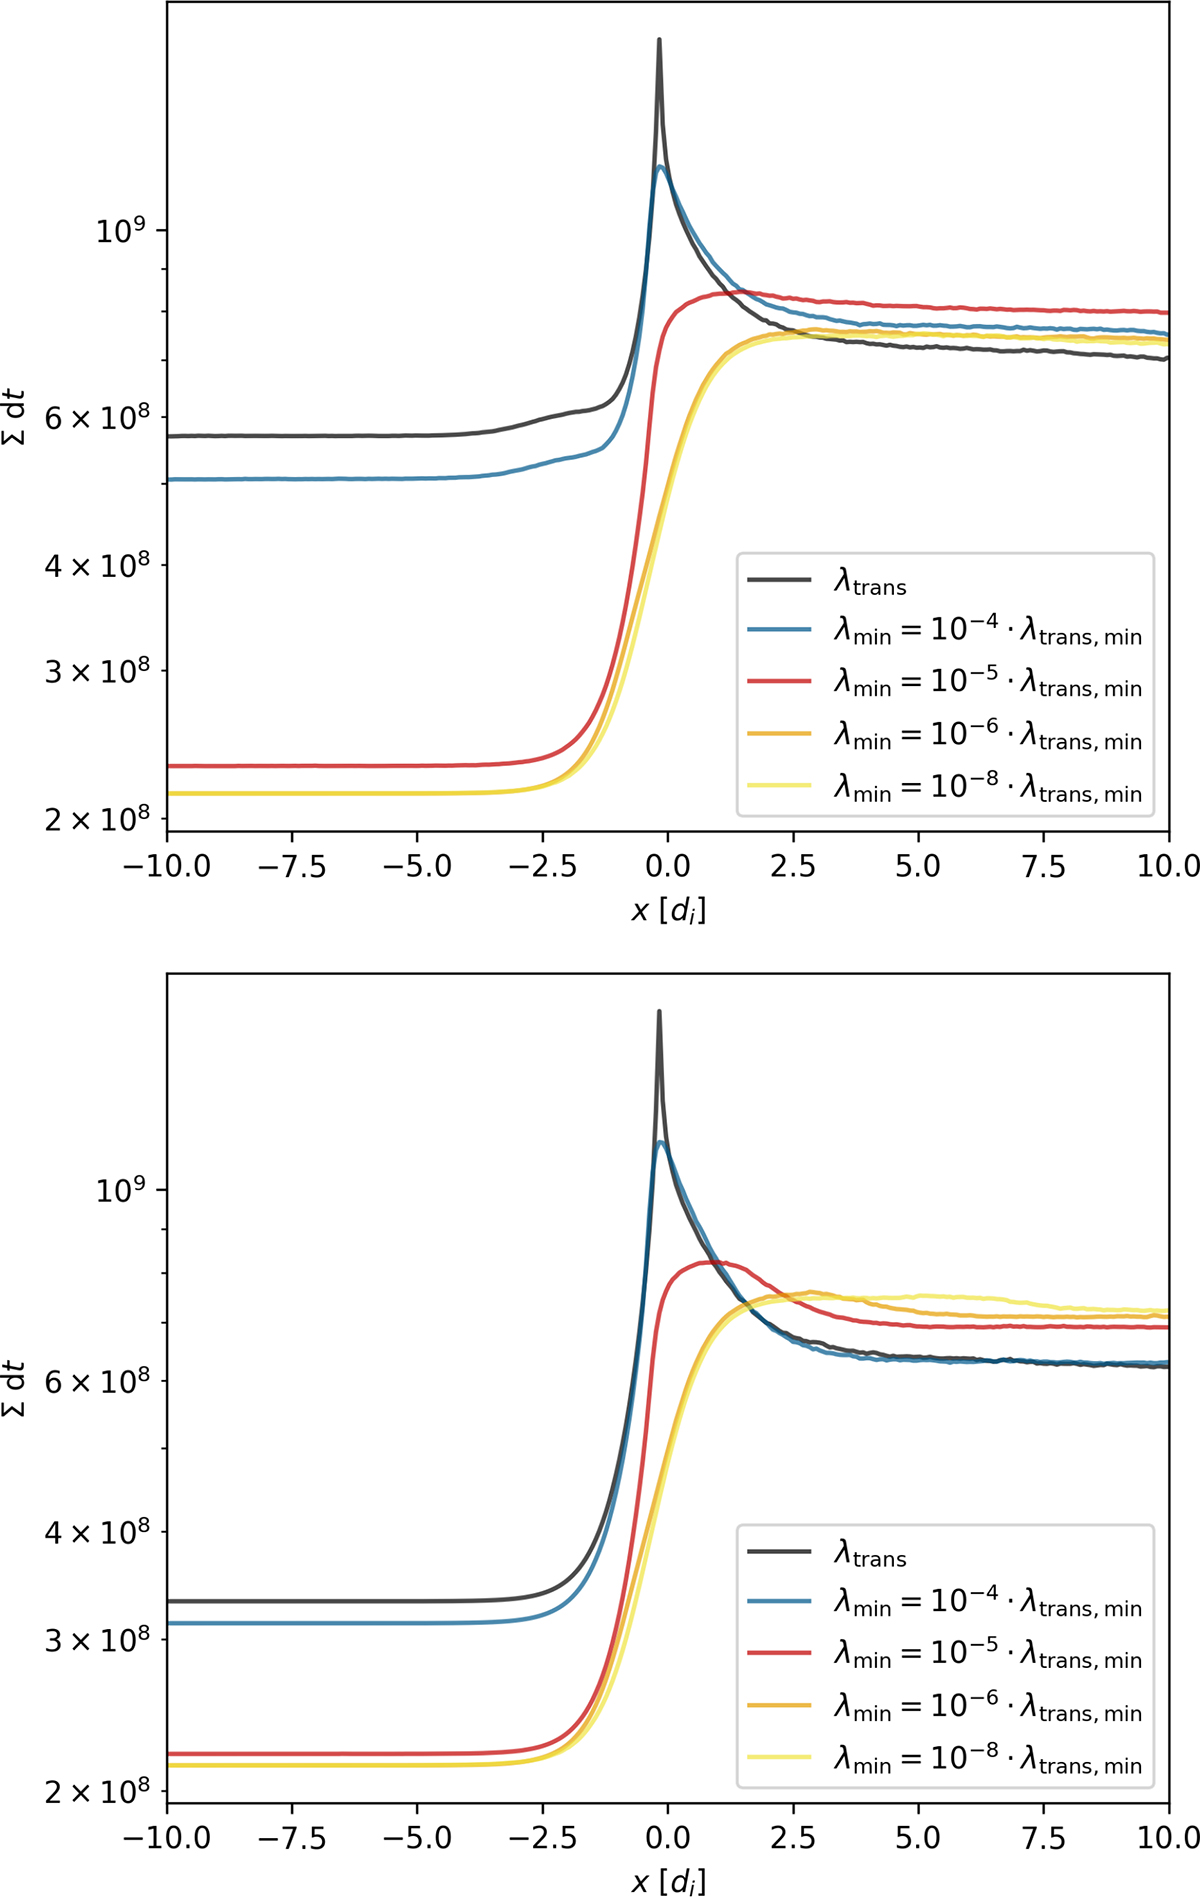
Fig. 6.
Download original image
Time-integrated histogram as explained in Fig. 5 of particle positions zoomed in to the vicinity of the shock for the simulation box extending to the injected particles’ diffusion length upstream and downstream (top) and the simulation box extending to 20 di upstream and downstream (bottom) for different minimum mean free paths at the shock.
Current usage metrics show cumulative count of Article Views (full-text article views including HTML views, PDF and ePub downloads, according to the available data) and Abstracts Views on Vision4Press platform.
Data correspond to usage on the plateform after 2015. The current usage metrics is available 48-96 hours after online publication and is updated daily on week days.
Initial download of the metrics may take a while.