Fig. 11
Download original image
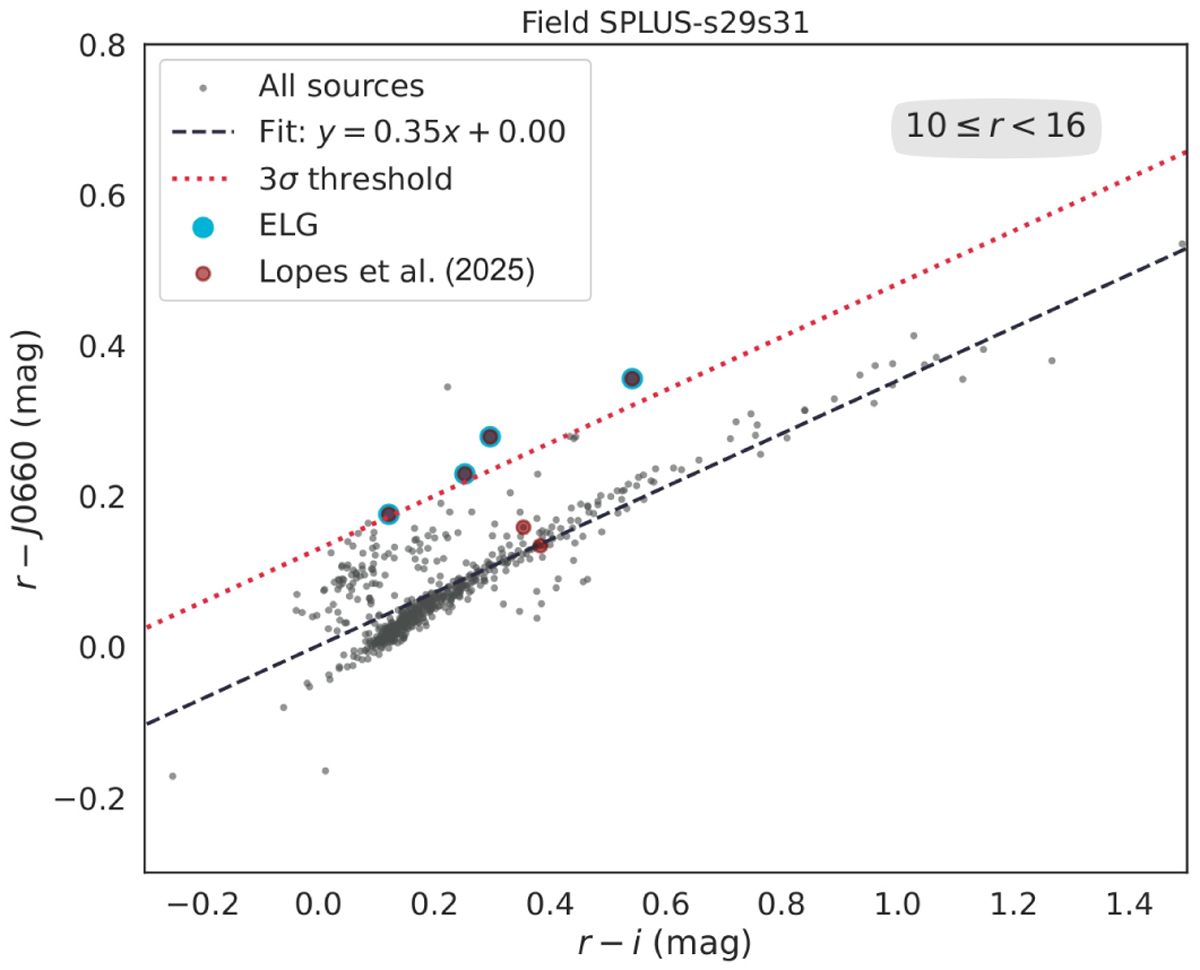
r − J0660) versus (r − i) color-color diagram for the field ID SPLUS-s29s31 with 10 mag < rband < 16 mag, considering all objects (stars and galaxies). The dashed black line corresponds to the stellar locus fit and the dotted red line represents a 3σ deviation from the stellar locus. We depict four ELGs identified by G25 in cyan and six ELGs by L25 in red.
Current usage metrics show cumulative count of Article Views (full-text article views including HTML views, PDF and ePub downloads, according to the available data) and Abstracts Views on Vision4Press platform.
Data correspond to usage on the plateform after 2015. The current usage metrics is available 48-96 hours after online publication and is updated daily on week days.
Initial download of the metrics may take a while.