Open Access
Fig. 2
Download original image
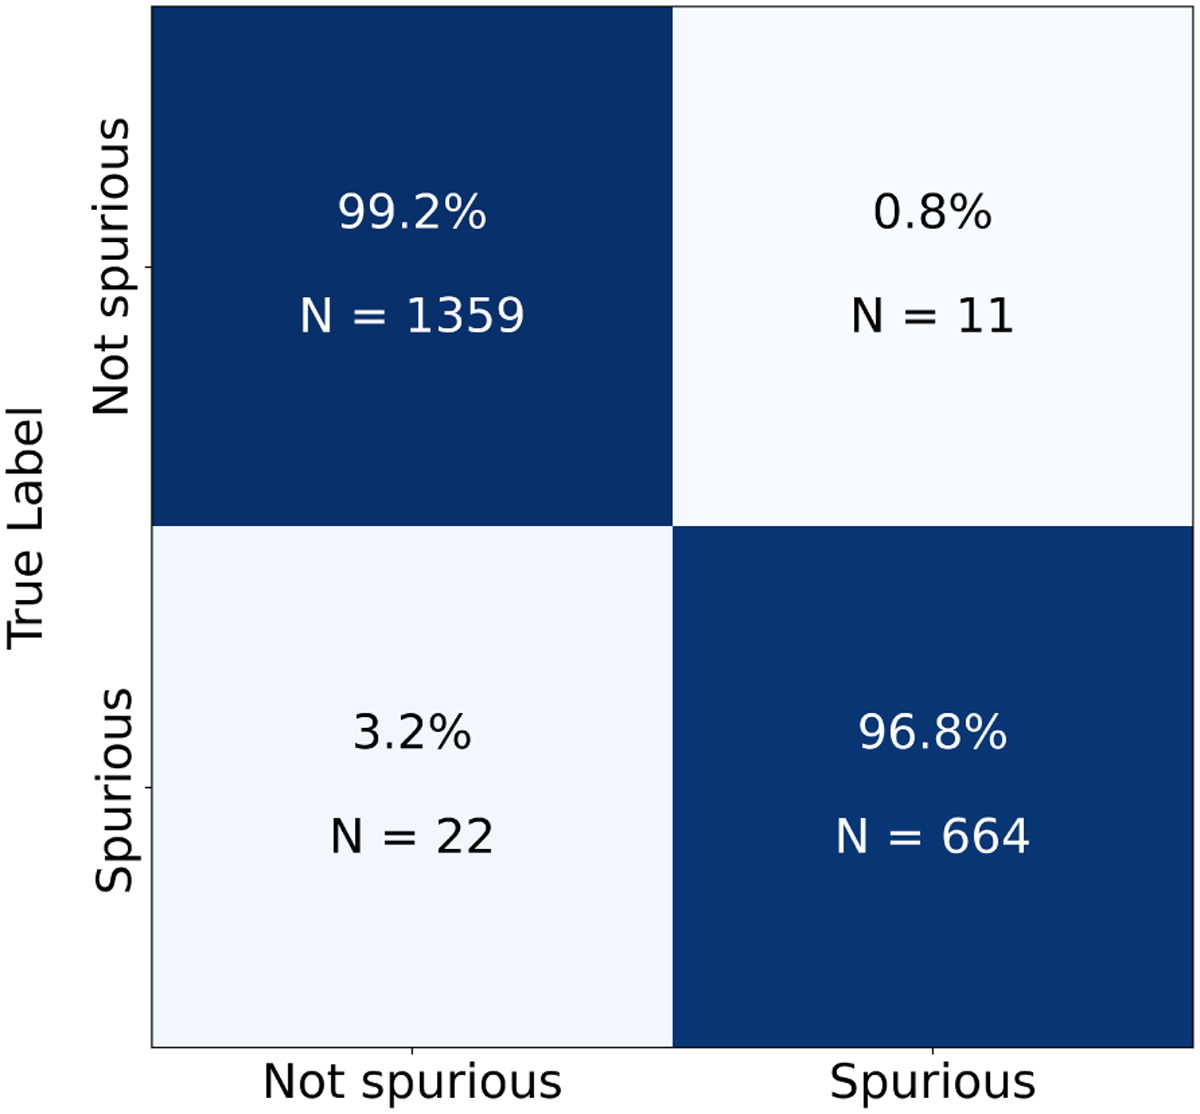
Confusion matrix for separation of spurious and non-spurious objects for the test sample (20%). On the vertical axis, we show the true source labels, and on the horizontal axis, we show the predicted labels. N represents the number of sources per label.
Current usage metrics show cumulative count of Article Views (full-text article views including HTML views, PDF and ePub downloads, according to the available data) and Abstracts Views on Vision4Press platform.
Data correspond to usage on the plateform after 2015. The current usage metrics is available 48-96 hours after online publication and is updated daily on week days.
Initial download of the metrics may take a while.