Fig. 6
Download original image
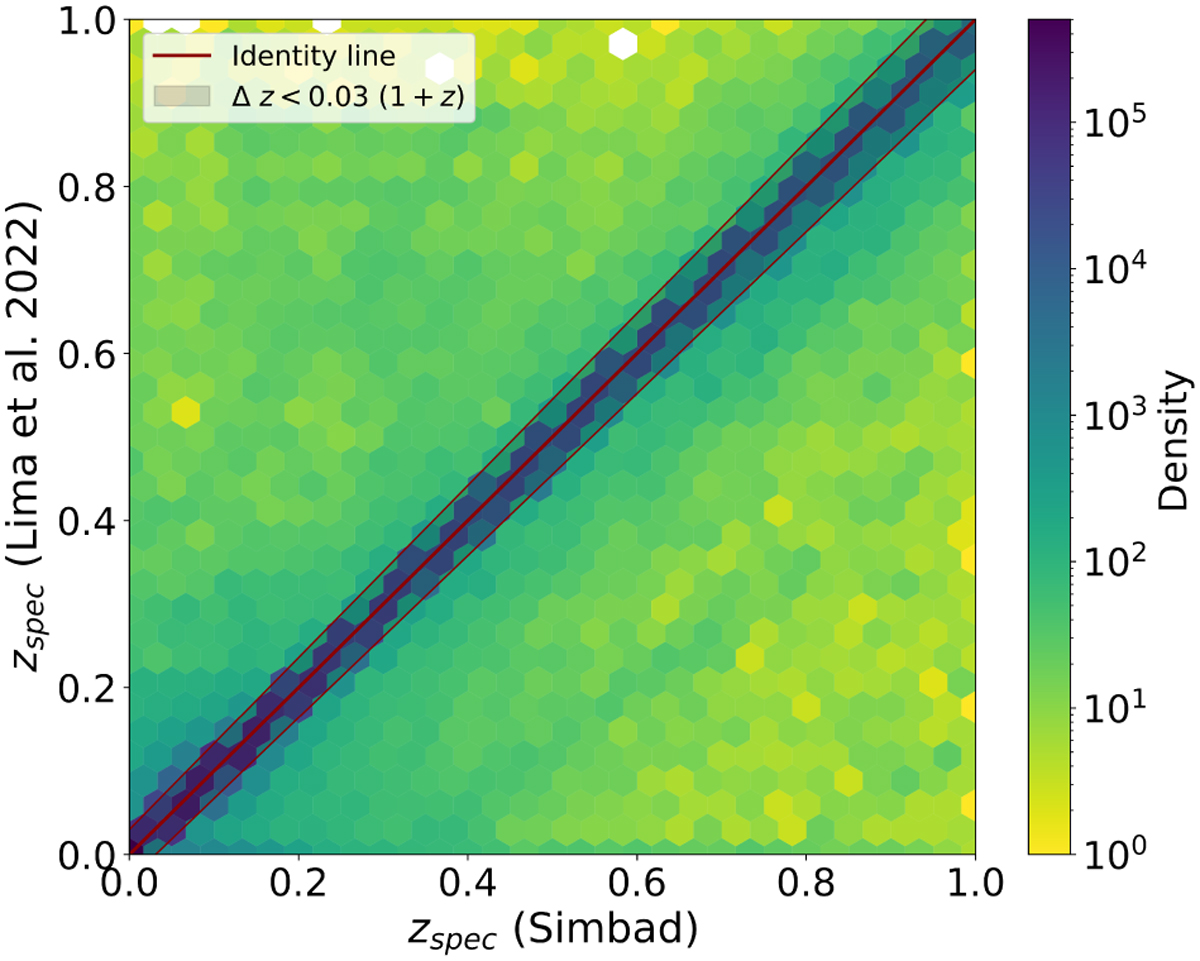
Comparison of zspec, provided by SIMBAD and Lima et al. (2022), that were utilized to build the spectroscopic sample employed to validate the zphot estimates. The red line is the identity line. The region colored in gray corresponds to the sources that display Δzspec < 0.03. The galaxies in that region constitute a double-checked sample that includes 85% of the total sources in the plot.
Current usage metrics show cumulative count of Article Views (full-text article views including HTML views, PDF and ePub downloads, according to the available data) and Abstracts Views on Vision4Press platform.
Data correspond to usage on the plateform after 2015. The current usage metrics is available 48-96 hours after online publication and is updated daily on week days.
Initial download of the metrics may take a while.