Open Access
Fig. 8
Download original image
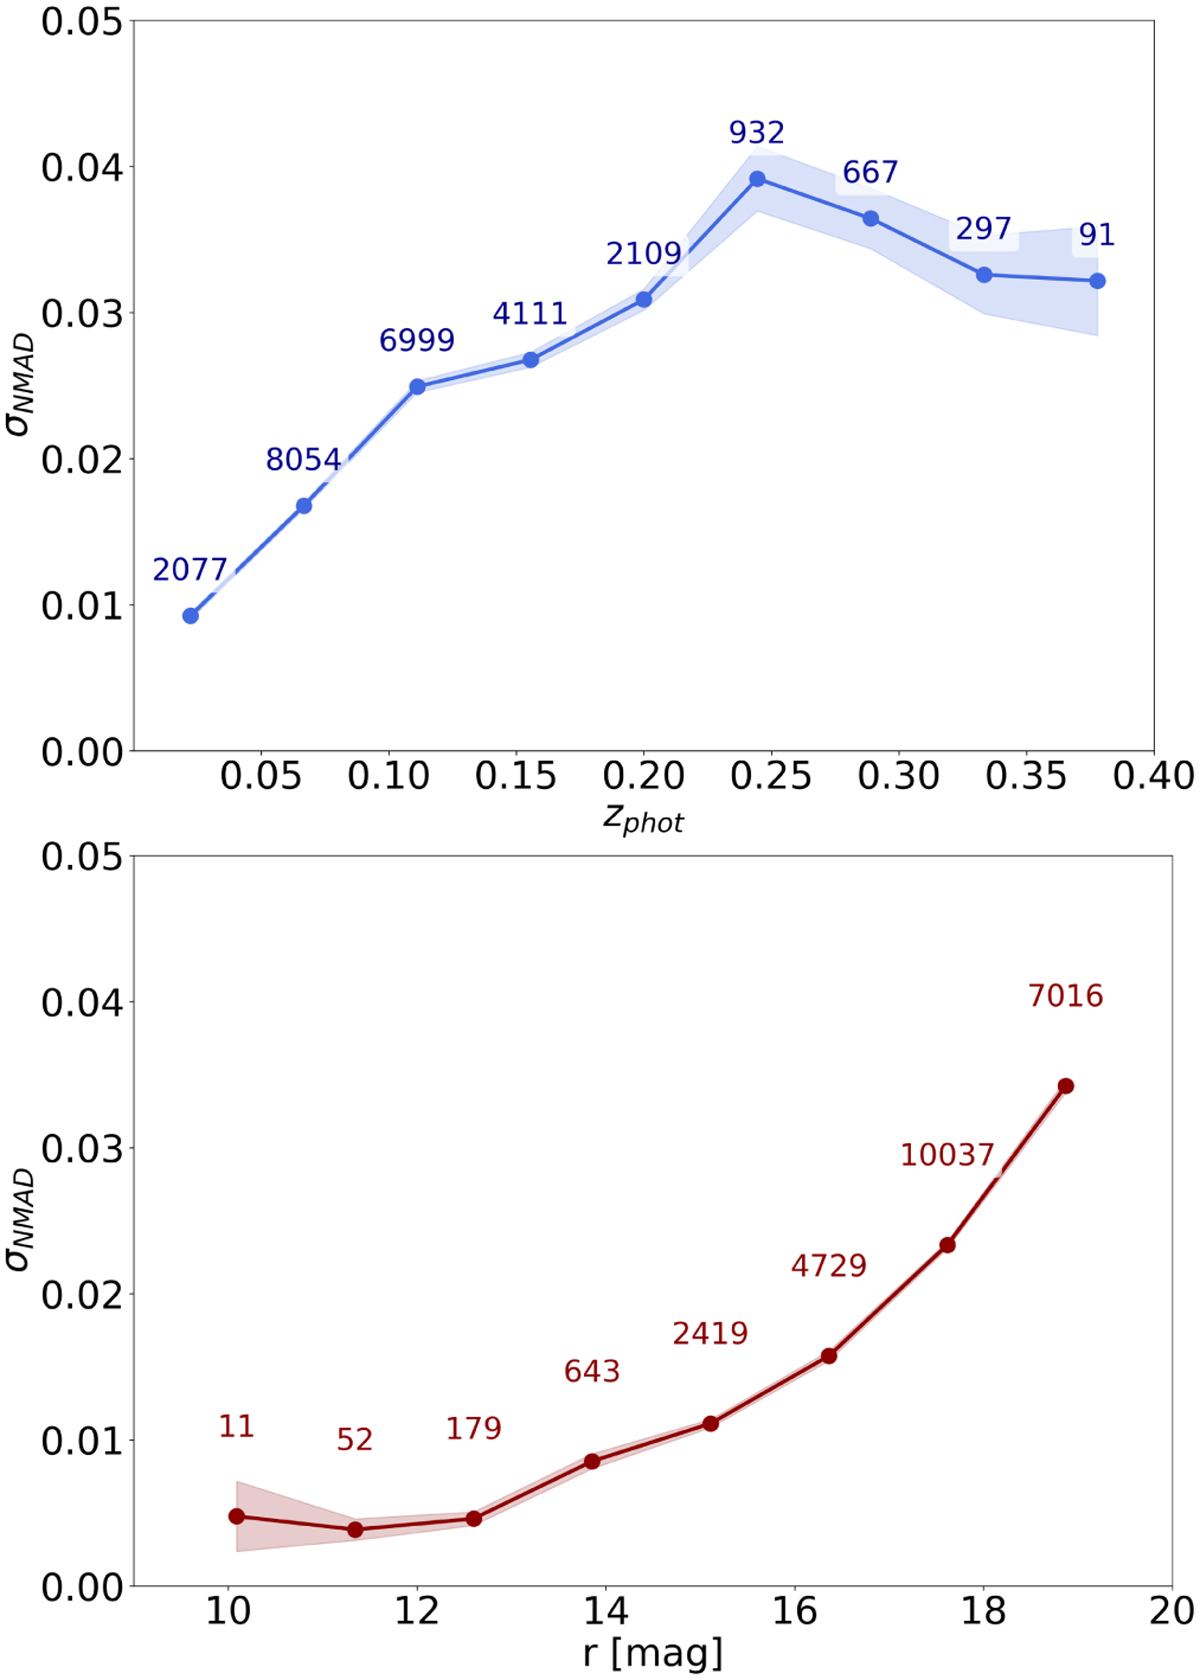
Top panel presents the evolution of σNMAD with zphot at different zphot bins. Above each bin we show the total number of galaxies considered in the calculation. Error bars and interpolation were calculated with bootstrapping. In the lower panel, we show the variation of σNMAD with rauto.
Current usage metrics show cumulative count of Article Views (full-text article views including HTML views, PDF and ePub downloads, according to the available data) and Abstracts Views on Vision4Press platform.
Data correspond to usage on the plateform after 2015. The current usage metrics is available 48-96 hours after online publication and is updated daily on week days.
Initial download of the metrics may take a while.