Fig. 9
Download original image
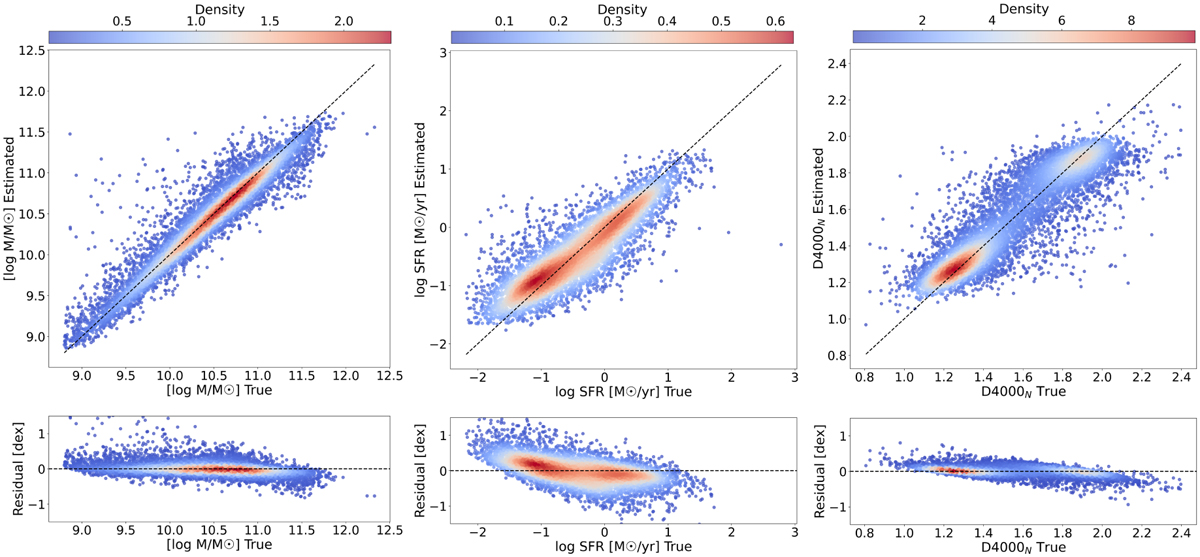
Comparison between true values provided spectroscopically by SDSS DR8 and the values predicted using ML, for stellar mass (left), SFR (center) and D4000N index (right). Each plot is colored according to density, and the black lines correspond to the identity lines. Each lower subplot represents the residual of the respective estimated property.
Current usage metrics show cumulative count of Article Views (full-text article views including HTML views, PDF and ePub downloads, according to the available data) and Abstracts Views on Vision4Press platform.
Data correspond to usage on the plateform after 2015. The current usage metrics is available 48-96 hours after online publication and is updated daily on week days.
Initial download of the metrics may take a while.