Open Access
Fig. B.1
Download original image
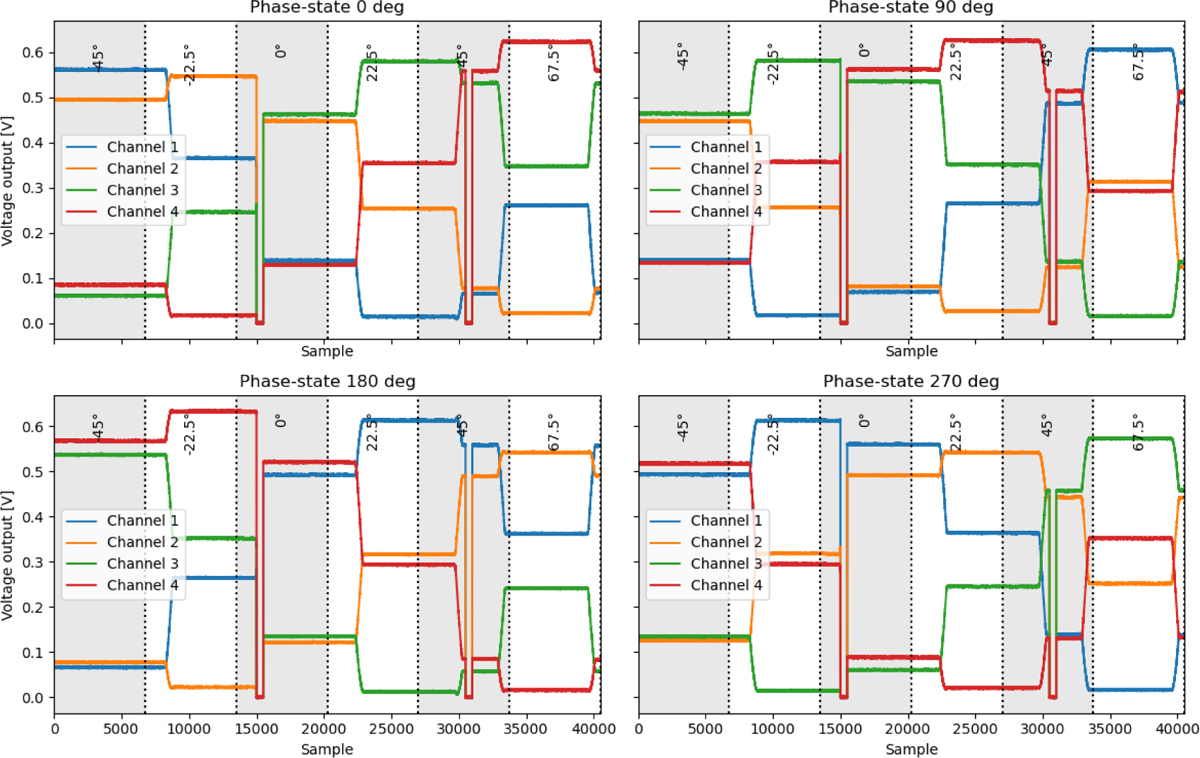
Data displayed for each phase state. From left to right and from top to bottom: 0, 90, 180, and 270 deg. Within each subplot, the output for the four channels is shown. The polarizer angle change is represented by alternating white and gray shades within each subplot.
Current usage metrics show cumulative count of Article Views (full-text article views including HTML views, PDF and ePub downloads, according to the available data) and Abstracts Views on Vision4Press platform.
Data correspond to usage on the plateform after 2015. The current usage metrics is available 48-96 hours after online publication and is updated daily on week days.
Initial download of the metrics may take a while.