Open Access
Fig. 3
Download original image
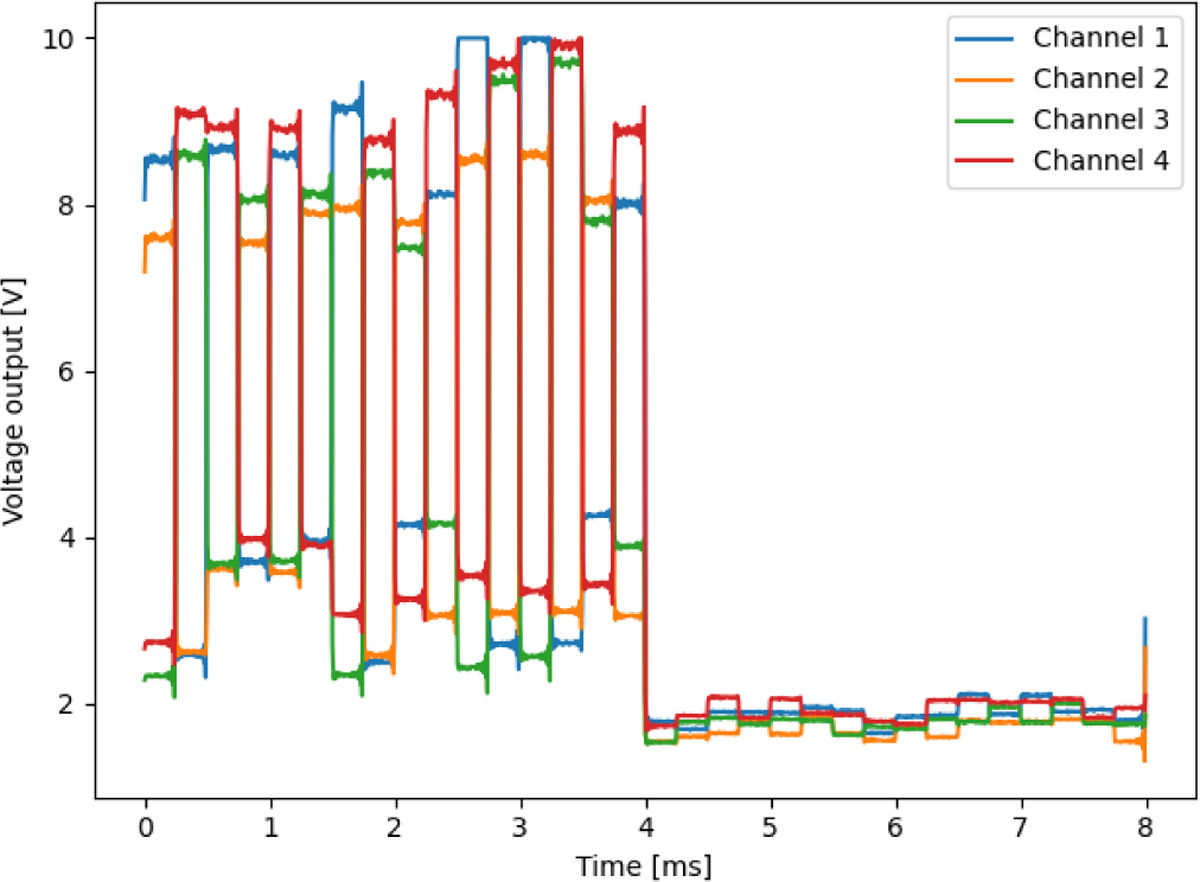
Example of a full data block, ~8 ms. The left part of the voltage output shows the diode “ON”, while the right part shows the diode “OFF”. Each color identifies a channel output. The signal exhibits saturation, reaching a value of 10 V, in some cases.
Current usage metrics show cumulative count of Article Views (full-text article views including HTML views, PDF and ePub downloads, according to the available data) and Abstracts Views on Vision4Press platform.
Data correspond to usage on the plateform after 2015. The current usage metrics is available 48-96 hours after online publication and is updated daily on week days.
Initial download of the metrics may take a while.