Fig. 4
Download original image
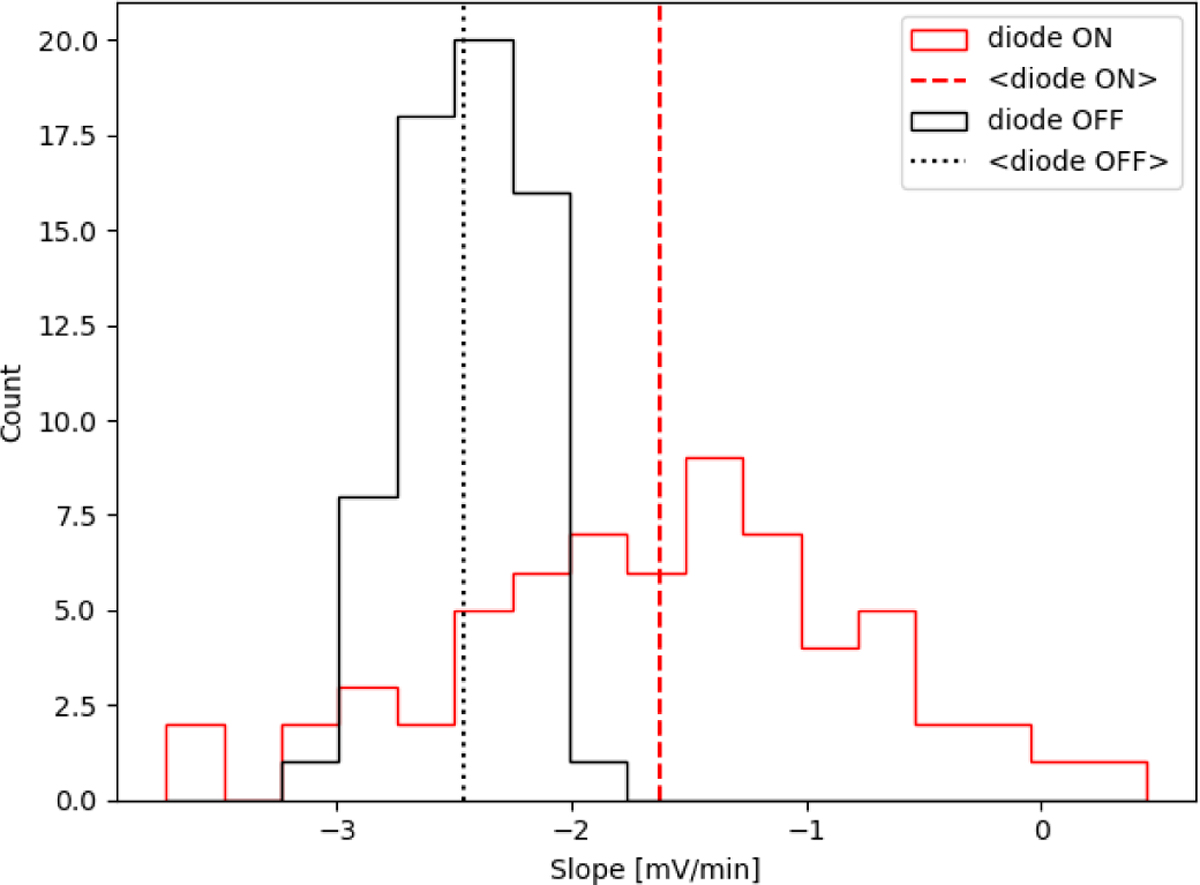
Histogram of the slopes that quantify the signal stability in a data acquisition of 1 minute. Each count is defined as a function of the slope obtained from linear fitting. The slope values span a range of ~ −2.5–0.5 mV/min for the diode ON case, indicating a lack of significant stability issues within 1 minute of integration.
Current usage metrics show cumulative count of Article Views (full-text article views including HTML views, PDF and ePub downloads, according to the available data) and Abstracts Views on Vision4Press platform.
Data correspond to usage on the plateform after 2015. The current usage metrics is available 48-96 hours after online publication and is updated daily on week days.
Initial download of the metrics may take a while.