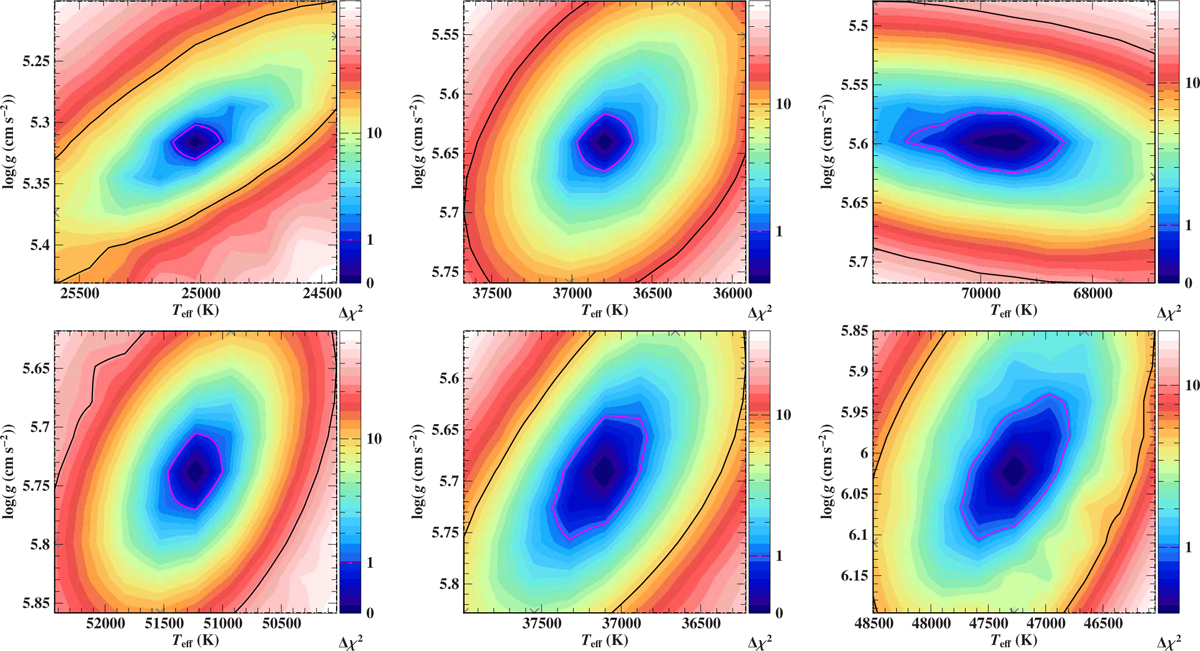
Fig. B.1
Download original image
Confidence maps for atmospheric parameters derived from spectroscopy. Examples are selected to cover different spectral types. The contour lines refer to single parameter uncertainties of 68% (red contour) and 99.7% (black contour), respectively. Top row: He-poor sdB/O stars. The cool sdB, HS2218+0201 (correlation coefficient r=0.73), the sdOB star HS1806+5024 (r=0.36), and the hot sdO HS2123+0045(r = −0.52) are shown. Bottom row: He-rich sdOs. iHe sdO HS1832+6955 (r=0.37), eHe sdOB HS1843+6343 (r=0.70), and eHe sdO HS1638+6733 (r=0.56) are shown.
Current usage metrics show cumulative count of Article Views (full-text article views including HTML views, PDF and ePub downloads, according to the available data) and Abstracts Views on Vision4Press platform.
Data correspond to usage on the plateform after 2015. The current usage metrics is available 48-96 hours after online publication and is updated daily on week days.
Initial download of the metrics may take a while.