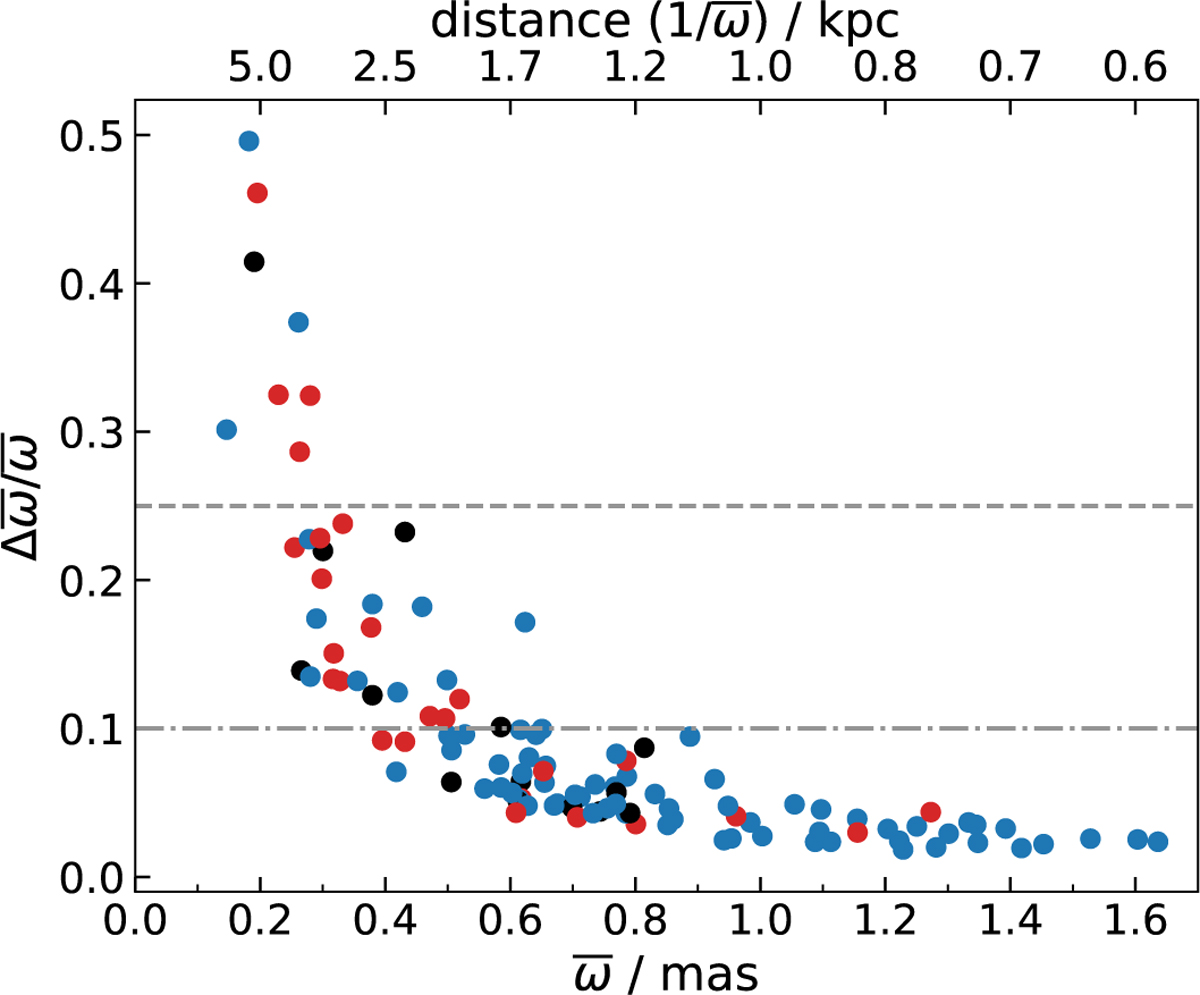
Fig. 3
Download original image
Distribution of parallax uncertainties as a function of parallax. The dot-dashed and dashed lines mark the 10% and 25% uncertainty levels, respectively. HS0941+4649 and HS1000+4704 are off the scale; their parallax uncertainties are larger than the parallax. He-poor stars are shown in blue, iHe rich ones in black, and eHe-rich in red.
Current usage metrics show cumulative count of Article Views (full-text article views including HTML views, PDF and ePub downloads, according to the available data) and Abstracts Views on Vision4Press platform.
Data correspond to usage on the plateform after 2015. The current usage metrics is available 48-96 hours after online publication and is updated daily on week days.
Initial download of the metrics may take a while.