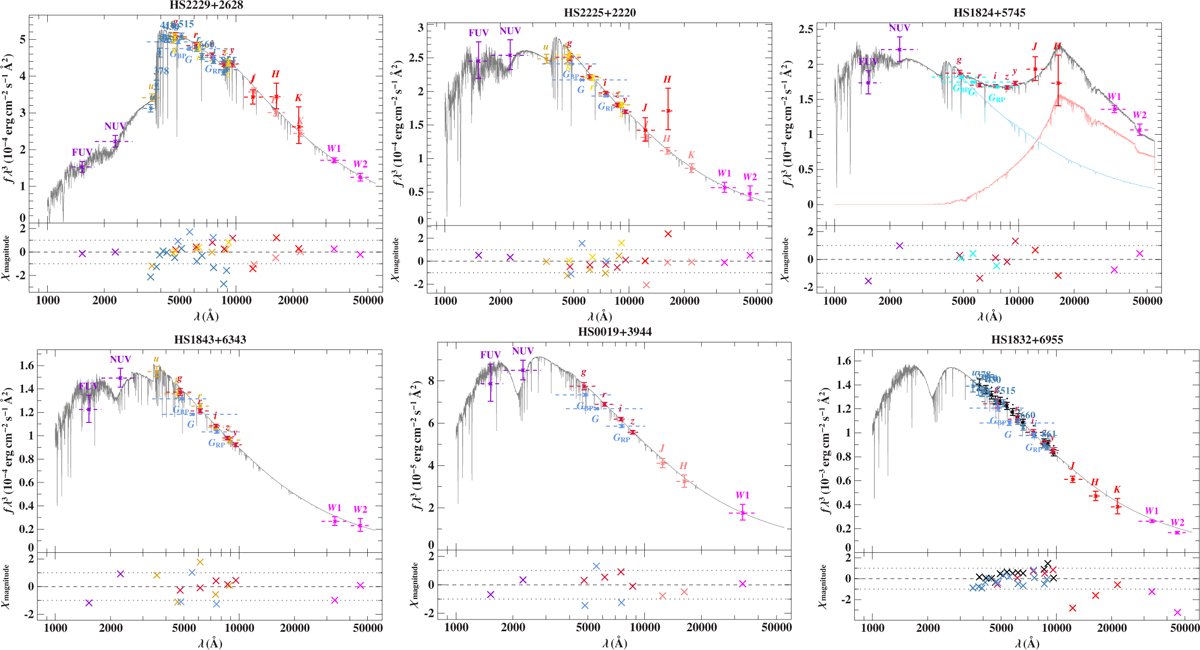
Fig. 9
Download original image
Fits of the SEDs of selected programme stars. Each plot consists of two panels. Upper panel: observed fluxes compared to the synthetic SED. To ease the slope of the distribution, the flux fλ is multiplied by the wavelength to the power of three. Photometric fluxes are displayed as coloured data points with their respective uncertainties and filter widths (dashed lines). The best-fit models are drawn as full-drawn grey lines. Lower panels: uncertainty-weighted residuals χ demonstrating the quality of the fit. The 2200 Å bump in the interstellar extinction curve clearly appears in significantly reddened objects. Top row: He-poor hot subdwarfs (from left to right) – sdB HS2229+2628, sdOB HS2225+2220, and composite sdB pulsator HS1824+5745. Bottom row: single He-sdOB/O stars (from left to right) – eHe sdOB HS1843+6343, eHe sdO HS0019+3944, and iHe-sdO HS1832+6955.
Current usage metrics show cumulative count of Article Views (full-text article views including HTML views, PDF and ePub downloads, according to the available data) and Abstracts Views on Vision4Press platform.
Data correspond to usage on the plateform after 2015. The current usage metrics is available 48-96 hours after online publication and is updated daily on week days.
Initial download of the metrics may take a while.